
|
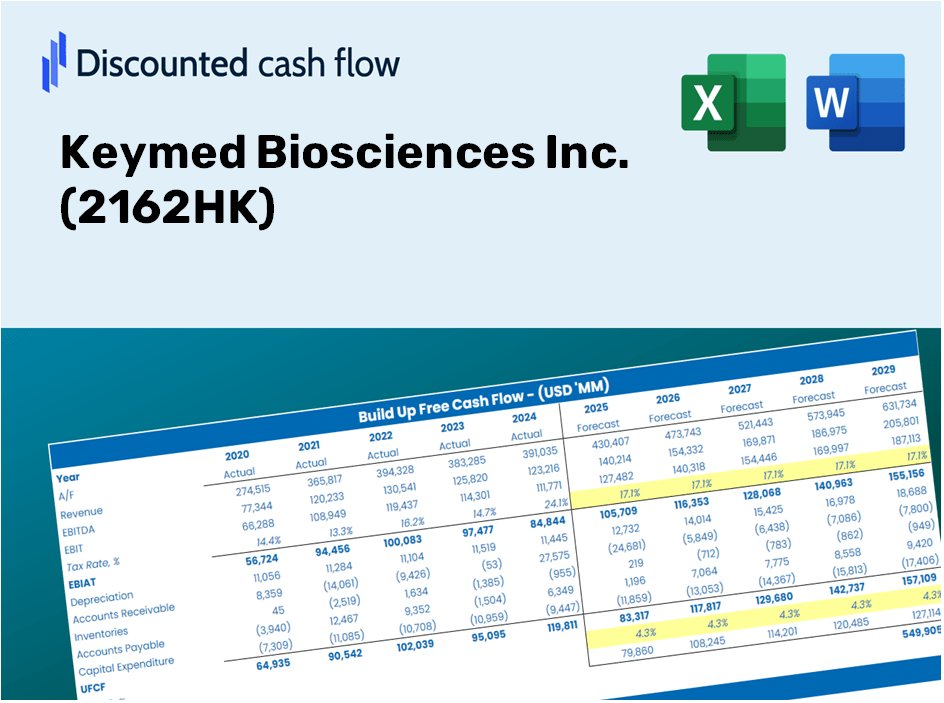
Keymed Biosciences Inc. (2162.HK) Évaluation DCF |
Entièrement Modifiable: Adapté À Vos Besoins Dans Excel Ou Sheets
Conception Professionnelle: Modèles Fiables Et Conformes Aux Normes Du Secteur
Pré-Construits Pour Une Utilisation Rapide Et Efficace
Compatible MAC/PC, entièrement débloqué
Aucune Expertise N'Est Requise; Facile À Suivre
Keymed Biosciences Inc. (2162.HK) Bundle
Vous cherchez à évaluer la valeur intrinsèque de Keymed Biosciences Inc.? Notre calculatrice DCF (2162HK) intègre des données réelles avec des fonctionnalités de personnalisation complètes, vous permettant d'affiner vos prévisions et de faire des choix d'investissement plus éclairés.
Discounted Cash Flow (DCF) - (USD MM)
| Year | AY1 2020 |
AY2 2021 |
AY3 2022 |
AY4 2023 |
AY5 2024 |
FY1 2025 |
FY2 2026 |
FY3 2027 |
FY4 2028 |
FY5 2029 |
|---|---|---|---|---|---|---|---|---|---|---|
| Revenue | .0 | 120.5 | 109.3 | 386.9 | 467.7 | 598.3 | 765.3 | 978.9 | 1,252.2 | 1,601.7 |
| Revenue Growth, % | 0 | 0 | -9.26 | 253.87 | 20.91 | 27.91 | 27.91 | 27.91 | 27.91 | 27.91 |
| EBITDA | -147.6 | -4,217.7 | -283.2 | -294.7 | -627.6 | -330.5 | -422.7 | -540.7 | -691.7 | -884.7 |
| EBITDA, % | 100 | -3500.97 | -259.09 | -76.19 | -134.18 | -55.24 | -55.24 | -55.24 | -55.24 | -55.24 |
| Depreciation | 15.2 | 23.0 | 39.5 | 75.6 | 56.4 | 223.5 | 285.8 | 365.6 | 467.7 | 598.2 |
| Depreciation, % | 100 | 19.06 | 36.1 | 19.53 | 12.06 | 37.35 | 37.35 | 37.35 | 37.35 | 37.35 |
| EBIT | -162.8 | -4,240.7 | -322.7 | -370.3 | -684.0 | -353.9 | -452.6 | -579.0 | -740.6 | -947.3 |
| EBIT, % | 100 | -3520.03 | -295.19 | -95.72 | -146.24 | -59.14 | -59.14 | -59.14 | -59.14 | -59.14 |
| Total Cash | 386.8 | 3,850.7 | 3,469.2 | 2,970.8 | 2,355.1 | 598.3 | 765.3 | 978.9 | 1,252.2 | 1,601.7 |
| Total Cash, percent | .0 | .0 | .0 | .0 | .0 | .0 | .0 | .0 | .0 | .0 |
| Account Receivables | .9 | 11.5 | .5 | 33.3 | 71.2 | 160.2 | 204.9 | 262.1 | 335.2 | 428.8 |
| Account Receivables, % | 100 | 9.57 | 0.4797 | 8.6 | 15.21 | 26.77 | 26.77 | 26.77 | 26.77 | 26.77 |
| Inventories | 7.5 | 17.9 | 48.6 | 66.8 | 121.7 | 242.4 | 310.1 | 396.7 | 507.4 | 649.0 |
| Inventories, % | 100 | 14.87 | 44.47 | 17.26 | 26.03 | 40.52 | 40.52 | 40.52 | 40.52 | 40.52 |
| Accounts Payable | 3.7 | 3.0 | 16.3 | 32.2 | 28.4 | 157.7 | 201.8 | 258.1 | 330.1 | 422.3 |
| Accounts Payable, % | 100 | 2.52 | 14.9 | 8.33 | 6.07 | 26.37 | 26.37 | 26.37 | 26.37 | 26.37 |
| Capital Expenditure | -21.7 | -188.9 | -305.4 | -418.0 | -234.3 | -418.9 | -535.9 | -685.4 | -876.8 | -1,121.5 |
| Capital Expenditure, % | 100 | -156.76 | -279.37 | -108.05 | -50.1 | -70.02 | -70.02 | -70.02 | -70.02 | -70.02 |
| Tax Rate, % | -1.3 | -1.3 | -1.3 | -1.3 | -1.3 | -1.3 | -1.3 | -1.3 | -1.3 | -1.3 |
| EBITAT | -165.5 | -4,247.0 | -327.5 | -373.6 | -692.9 | -353.9 | -452.6 | -579.0 | -740.6 | -947.3 |
| Depreciation | ||||||||||
| Changes in Account Receivables | ||||||||||
| Changes in Inventories | ||||||||||
| Changes in Accounts Payable | ||||||||||
| Capital Expenditure | ||||||||||
| UFCF | -176.7 | -4,434.6 | -599.9 | -751.0 | -967.5 | -629.7 | -771.0 | -986.2 | -1,261.5 | -1,613.6 |
| WACC, % | 4.64 | 4.64 | 4.64 | 4.64 | 4.64 | 4.64 | 4.64 | 4.64 | 4.64 | 4.64 |
| PV UFCF | ||||||||||
| SUM PV UFCF | -4,505.5 | |||||||||
| Long Term Growth Rate, % | 2.00 | |||||||||
| Free cash flow (T + 1) | -1,646 | |||||||||
| Terminal Value | -62,409 | |||||||||
| Present Terminal Value | -49,753 | |||||||||
| Enterprise Value | -54,258 | |||||||||
| Net Debt | 366 | |||||||||
| Equity Value | -54,624 | |||||||||
| Diluted Shares Outstanding, MM | 262 | |||||||||
| Equity Value Per Share | -208.53 |
Discover What You Receive
- Accurate Keymed Financials: Comprehensive historical and projected data for precise valuation.
- Customizable Parameters: Adjust WACC, tax rates, revenue growth, and capital expenditures as needed.
- Real-Time Calculations: Automatically computes intrinsic value and NPV.
- Scenario Evaluation: Experiment with various scenarios to assess Keymed’s future prospects.
- User-Friendly Interface: Designed for industry experts while remaining accessible to newcomers.
Key Features
- Comprehensive DCF Calculator: Offers detailed unlevered and levered DCF valuation models tailored for Keymed Biosciences Inc. (2162HK).
- Customizable WACC Calculator: Features a pre-configured Weighted Average Cost of Capital sheet with adjustable inputs specific to the biotechnology sector.
- Dynamic Forecast Assumptions: Easily adjust parameters such as growth rates, capital expenditures, and discount rates to reflect your projections.
- Integrated Financial Ratios: Evaluate profitability, leverage, and efficiency ratios for Keymed Biosciences Inc. (2162HK) at a glance.
- User-Friendly Dashboard and Charts: Visual representations provide a clear overview of key valuation metrics for straightforward analysis.
How It Functions
- Download the Template: Gain immediate access to the Excel-based Keymed Biosciences Inc. DCF Calculator.
- Input Your Assumptions: Modify the yellow-highlighted cells to set your growth rates, WACC, margins, and other variables.
- Instant Calculations: The model automatically recalculates the intrinsic value of Keymed Biosciences Inc. (2162HK).
- Test Scenarios: Experiment with various assumptions to assess potential shifts in valuation.
- Analyze and Decide: Utilize the results to inform your investment or financial evaluation.
Why Choose Keymed Biosciences Inc. (2162HK)?
- User-Friendly Interface: Crafted for novices and seasoned professionals alike.
- Customizable Inputs: Effortlessly adjust parameters to suit your analysis needs.
- Real-Time Updates: Observe immediate changes in Keymed's valuation as you tweak inputs.
- Preloaded Data: Comes equipped with Keymed’s latest financial information for swift evaluations.
- Preferred by Experts: Utilized by investors and analysts for strategic decision-making.
Who Should Use This Product?
- Individual Investors: Gain insights to make educated choices when trading Keymed Biosciences Inc. (2162HK) stock.
- Financial Analysts: Enhance your valuation processes with comprehensive financial models specifically designed for Keymed Biosciences Inc. (2162HK).
- Consultants: Provide timely and accurate valuation insights on Keymed Biosciences Inc. (2162HK) to your clients.
- Business Owners: Learn about the valuation methods of major players like Keymed Biosciences Inc. (2162HK) to inform your business strategy.
- Finance Students: Explore valuation techniques through real-world data and scenarios related to Keymed Biosciences Inc. (2162HK).
Contents of the Template
- Detailed DCF Model: Editable template featuring thorough valuation calculations.
- Actual Financial Data: Keymed Biosciences Inc.'s historical and projected financials preloaded for your analysis.
- Adjustable Parameters: Modify WACC, growth rates, and tax assumptions to explore different scenarios.
- Comprehensive Financial Statements: Complete annual and quarterly breakdowns for enhanced insights.
- Essential Ratios: Integrated analysis covering profitability, efficiency, and leverage metrics.
- Dashboard with Visual Representations: Graphs and tables providing clear, actionable results.
Disclaimer
All information, articles, and product details provided on this website are for general informational and educational purposes only. We do not claim any ownership over, nor do we intend to infringe upon, any trademarks, copyrights, logos, brand names, or other intellectual property mentioned or depicted on this site. Such intellectual property remains the property of its respective owners, and any references here are made solely for identification or informational purposes, without implying any affiliation, endorsement, or partnership.
We make no representations or warranties, express or implied, regarding the accuracy, completeness, or suitability of any content or products presented. Nothing on this website should be construed as legal, tax, investment, financial, medical, or other professional advice. In addition, no part of this site—including articles or product references—constitutes a solicitation, recommendation, endorsement, advertisement, or offer to buy or sell any securities, franchises, or other financial instruments, particularly in jurisdictions where such activity would be unlawful.
All content is of a general nature and may not address the specific circumstances of any individual or entity. It is not a substitute for professional advice or services. Any actions you take based on the information provided here are strictly at your own risk. You accept full responsibility for any decisions or outcomes arising from your use of this website and agree to release us from any liability in connection with your use of, or reliance upon, the content or products found herein.