
|
Percevoir & Man Manufacturing Limited (2314.HK) Évaluation DCF |
Entièrement Modifiable: Adapté À Vos Besoins Dans Excel Ou Sheets
Conception Professionnelle: Modèles Fiables Et Conformes Aux Normes Du Secteur
Pré-Construits Pour Une Utilisation Rapide Et Efficace
Compatible MAC/PC, entièrement débloqué
Aucune Expertise N'Est Requise; Facile À Suivre
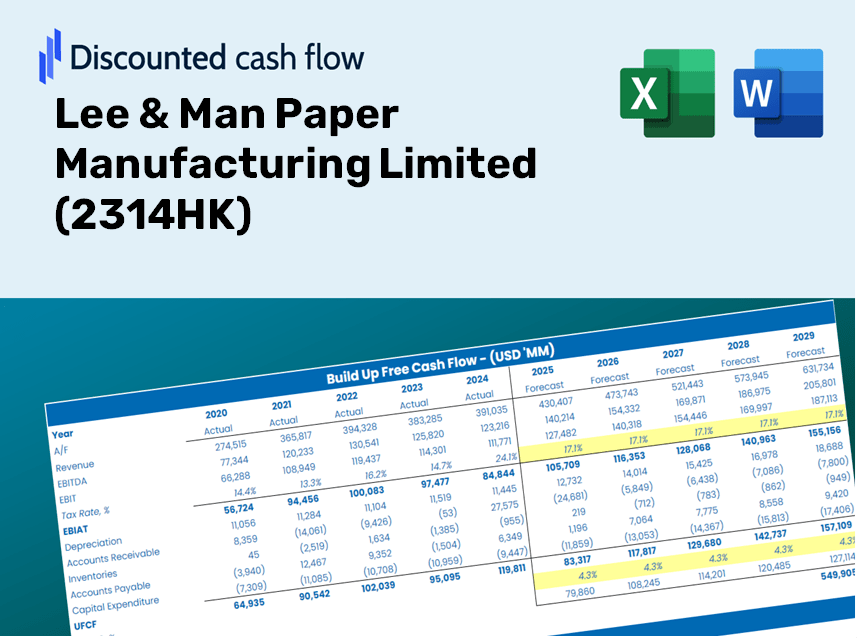
Lee & Man Paper Manufacturing Limited (2314.HK) Bundle
Évaluer les perspectives financières de Lee & Man Manufacturing Limited comme un expert! Cette calculatrice DCF (2314HK) propose des données financières pré-remplies et la flexibilité pour modifier la croissance des revenus, le WACC, les marges et d'autres hypothèses essentielles pour s'aligner sur vos prévisions.
Discounted Cash Flow (DCF) - (USD MM)
| Year | AY1 2020 |
AY2 2021 |
AY3 2022 |
AY4 2023 |
AY5 2024 |
FY1 2025 |
FY2 2026 |
FY3 2027 |
FY4 2028 |
FY5 2029 |
|---|---|---|---|---|---|---|---|---|---|---|
| Revenue | 25,868.0 | 32,511.4 | 29,170.4 | 24,937.1 | 25,995.4 | 26,329.3 | 26,667.4 | 27,010.0 | 27,356.9 | 27,708.2 |
| Revenue Growth, % | 0 | 25.68 | -10.28 | -14.51 | 4.24 | 1.28 | 1.28 | 1.28 | 1.28 | 1.28 |
| EBITDA | 4,672.2 | 4,036.1 | 1,774.0 | 1,863.3 | 2,191.2 | 2,762.4 | 2,797.9 | 2,833.8 | 2,870.2 | 2,907.1 |
| EBITDA, % | 18.06 | 12.41 | 6.08 | 7.47 | 8.43 | 10.49 | 10.49 | 10.49 | 10.49 | 10.49 |
| Depreciation | 171.4 | 165.3 | 191.5 | 174.5 | 263.3 | 186.4 | 188.8 | 191.3 | 193.7 | 196.2 |
| Depreciation, % | 0.66279 | 0.50829 | 0.65649 | 0.69995 | 1.01 | 0.70808 | 0.70808 | 0.70808 | 0.70808 | 0.70808 |
| EBIT | 4,500.8 | 3,870.8 | 1,582.5 | 1,688.8 | 1,927.9 | 2,576.0 | 2,609.0 | 2,642.6 | 2,676.5 | 2,710.9 |
| EBIT, % | 17.4 | 11.91 | 5.42 | 6.77 | 7.42 | 9.78 | 9.78 | 9.78 | 9.78 | 9.78 |
| Total Cash | 1,184.9 | 1,908.8 | 1,798.3 | 1,517.1 | 1,521.2 | 1,503.5 | 1,522.8 | 1,542.4 | 1,562.2 | 1,582.3 |
| Total Cash, percent | .0 | .0 | .0 | .0 | .0 | .0 | .0 | .0 | .0 | .0 |
| Account Receivables | 5,678.0 | 6,566.7 | 5,466.3 | 6,701.2 | 3,910.7 | 5,413.5 | 5,483.0 | 5,553.4 | 5,624.8 | 5,697.0 |
| Account Receivables, % | 21.95 | 20.2 | 18.74 | 26.87 | 15.04 | 20.56 | 20.56 | 20.56 | 20.56 | 20.56 |
| Inventories | 5,139.7 | 6,527.2 | 5,656.3 | 4,921.1 | 4,419.3 | 5,058.9 | 5,123.9 | 5,189.7 | 5,256.4 | 5,323.9 |
| Inventories, % | 19.87 | 20.08 | 19.39 | 19.73 | 17 | 19.21 | 19.21 | 19.21 | 19.21 | 19.21 |
| Accounts Payable | 1,455.2 | 1,673.2 | 2,585.2 | 2,486.1 | 2,374.3 | 2,039.9 | 2,066.1 | 2,092.6 | 2,119.5 | 2,146.7 |
| Accounts Payable, % | 5.63 | 5.15 | 8.86 | 9.97 | 9.13 | 7.75 | 7.75 | 7.75 | 7.75 | 7.75 |
| Capital Expenditure | -3,339.6 | -3,317.7 | -4,742.2 | -3,701.7 | -2,704.3 | -3,402.8 | -3,446.5 | -3,490.7 | -3,535.6 | -3,581.0 |
| Capital Expenditure, % | -12.91 | -10.2 | -16.26 | -14.84 | -10.4 | -12.92 | -12.92 | -12.92 | -12.92 | -12.92 |
| Tax Rate, % | 15.76 | 15.76 | 15.76 | 15.76 | 15.76 | 15.76 | 15.76 | 15.76 | 15.76 | 15.76 |
| EBITAT | 3,804.1 | 3,316.9 | 1,428.0 | 1,256.6 | 1,624.1 | 2,159.2 | 2,186.9 | 2,215.0 | 2,243.4 | 2,272.3 |
| Depreciation | ||||||||||
| Changes in Account Receivables | ||||||||||
| Changes in Inventories | ||||||||||
| Changes in Accounts Payable | ||||||||||
| Capital Expenditure | ||||||||||
| UFCF | -8,726.6 | -1,893.8 | -239.4 | -2,869.4 | 2,363.5 | -3,533.9 | -1,179.0 | -1,194.2 | -1,209.5 | -1,225.0 |
| WACC, % | 4.63 | 4.66 | 4.76 | 4.39 | 4.62 | 4.61 | 4.61 | 4.61 | 4.61 | 4.61 |
| PV UFCF | ||||||||||
| SUM PV UFCF | -7,486.2 | |||||||||
| Long Term Growth Rate, % | 2.00 | |||||||||
| Free cash flow (T + 1) | -1,250 | |||||||||
| Terminal Value | -47,832 | |||||||||
| Present Terminal Value | -38,177 | |||||||||
| Enterprise Value | -45,663 | |||||||||
| Net Debt | 20,529 | |||||||||
| Equity Value | -66,192 | |||||||||
| Diluted Shares Outstanding, MM | 4,296 | |||||||||
| Equity Value Per Share | -15.41 |
Benefits You Will Receive
- Flexible Forecast Inputs: Effortlessly adjust parameters (growth %, margins, WACC) to explore various scenarios.
- Real-Time Financial Data: Pre-loaded financial information for Lee & Man Paper Manufacturing Limited (2314HK) to enhance your analysis.
- Automated DCF Outputs: The model computes the Net Present Value (NPV) and intrinsic value automatically.
- Customizable and Professional Design: An elegant Excel template tailored to meet your valuation requirements.
- Engineered for Analysts and Investors: Perfect for evaluating projections, confirming strategies, and optimizing your time.
Key Features
- Real-Life LMP Data: Pre-filled with Lee & Man Paper Manufacturing Limited's historical financials and future projections.
- Fully Customizable Inputs: Adjust revenue growth, profit margins, discount rates, tax rates, and capital expenditures.
- Dynamic Valuation Model: Automatic updates to Net Present Value (NPV) and intrinsic value based on your adjustments.
- Scenario Testing: Generate multiple forecast scenarios to evaluate various valuation outcomes.
- User-Friendly Design: Intuitive, organized design suitable for both professionals and newcomers.
How It Functions
- Download: Obtain the pre-formatted Excel spreadsheet containing Lee & Man Paper Manufacturing Limited’s financial data (2314HK).
- Customize: Modify forecasts such as revenue growth, EBITDA percentage, and WACC to suit your analysis.
- Update Automatically: Enjoy real-time updates for intrinsic value and NPV calculations.
- Test Scenarios: Generate various projections and analyze the results side by side.
- Make Decisions: Leverage the valuation insights to inform your investment approach.
Why Choose This Calculator for Lee & Man Paper Manufacturing Limited (2314HK)?
- Precision: Utilizes authentic financial data for Lee & Man Paper Manufacturing to guarantee accuracy.
- Adaptability: Created for users to easily test and modify their input variables.
- Efficiency: Avoid the complexities of constructing a DCF model from the ground up.
- Expert-Level: Built with the expertise and usability principles suited for CFOs.
- Intuitive: Simple to navigate, even for those lacking advanced financial modeling skills.
Who Can Benefit from This Product?
- Finance Students: Master valuation techniques and practice with real-world data from Lee & Man Paper Manufacturing Limited (2314HK).
- Academics: Integrate industry models into your teaching or research related to Lee & Man Paper Manufacturing Limited (2314HK).
- Investors: Validate your hypotheses and evaluate the valuation results for Lee & Man Paper Manufacturing Limited (2314HK).
- Analysts: Enhance your efficiency with a ready-to-use, customizable DCF model tailored for Lee & Man Paper Manufacturing Limited (2314HK).
- Small Business Owners: Understand the analytical approaches applied to large public companies like Lee & Man Paper Manufacturing Limited (2314HK).
Contents of the Template
- Operating and Balance Sheet Data: Pre-filled historical data and forecasts for Lee & Man Paper Manufacturing Limited (2314HK), including metrics such as revenue, EBITDA, EBIT, and capital expenditures.
- WACC Calculation: A dedicated sheet for calculating the Weighted Average Cost of Capital (WACC), featuring parameters like Beta, risk-free rate, and share price.
- DCF Valuation (Unlevered and Levered): Customizable Discounted Cash Flow models that illustrate intrinsic value with comprehensive calculations.
- Financial Statements: Pre-loaded financial statements (annual and quarterly) available for in-depth analysis.
- Key Ratios: Includes key profitability, leverage, and efficiency ratios relevant to Lee & Man Paper Manufacturing Limited (2314HK).
- Dashboard and Charts: A visual summary showcasing valuation outputs and assumptions for straightforward result analysis.
Disclaimer
All information, articles, and product details provided on this website are for general informational and educational purposes only. We do not claim any ownership over, nor do we intend to infringe upon, any trademarks, copyrights, logos, brand names, or other intellectual property mentioned or depicted on this site. Such intellectual property remains the property of its respective owners, and any references here are made solely for identification or informational purposes, without implying any affiliation, endorsement, or partnership.
We make no representations or warranties, express or implied, regarding the accuracy, completeness, or suitability of any content or products presented. Nothing on this website should be construed as legal, tax, investment, financial, medical, or other professional advice. In addition, no part of this site—including articles or product references—constitutes a solicitation, recommendation, endorsement, advertisement, or offer to buy or sell any securities, franchises, or other financial instruments, particularly in jurisdictions where such activity would be unlawful.
All content is of a general nature and may not address the specific circumstances of any individual or entity. It is not a substitute for professional advice or services. Any actions you take based on the information provided here are strictly at your own risk. You accept full responsibility for any decisions or outcomes arising from your use of this website and agree to release us from any liability in connection with your use of, or reliance upon, the content or products found herein.