
|
XD Inc. (2400.hk) Évaluation DCF |
Entièrement Modifiable: Adapté À Vos Besoins Dans Excel Ou Sheets
Conception Professionnelle: Modèles Fiables Et Conformes Aux Normes Du Secteur
Pré-Construits Pour Une Utilisation Rapide Et Efficace
Compatible MAC/PC, entièrement débloqué
Aucune Expertise N'Est Requise; Facile À Suivre
XD Inc. (2400.HK) Bundle
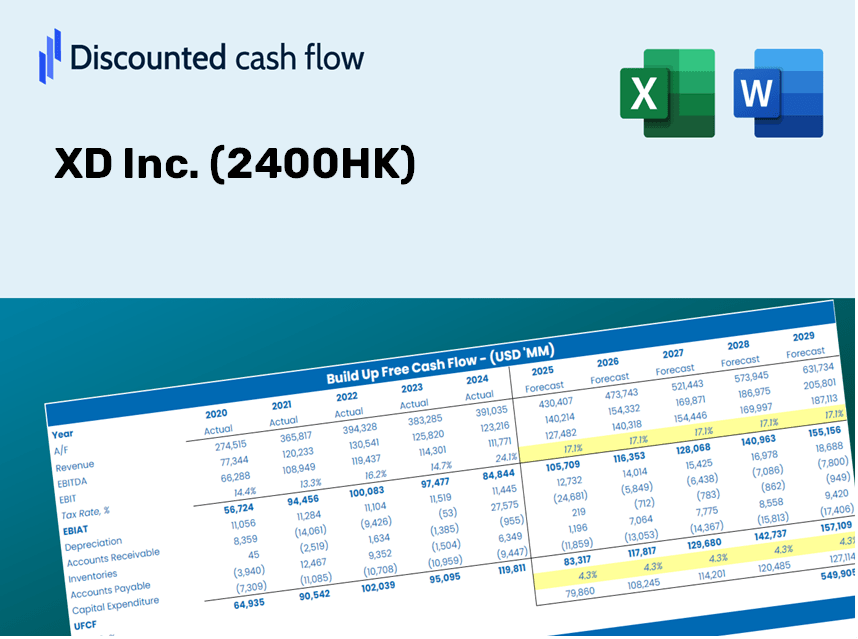
Découvrez le véritable potentiel de XD Inc. (2400HK) avec notre calculatrice DCF de niveau supérieur! Ajustez les hypothèses clés, explorez divers scénarios et examinez comment les modifications affectent la valorisation XD Inc. (2400HK) - le tout dans un modèle Excel convivial.
Discounted Cash Flow (DCF) - (USD MM)
| Year | AY1 2020 |
AY2 2021 |
AY3 2022 |
AY4 2023 |
AY5 2024 |
FY1 2025 |
FY2 2026 |
FY3 2027 |
FY4 2028 |
FY5 2029 |
|---|---|---|---|---|---|---|---|---|---|---|
| Revenue | 3,111.1 | 2,953.3 | 3,748.4 | 3,702.8 | 5,475.9 | 6,414.0 | 7,512.7 | 8,799.6 | 10,307.0 | 12,072.7 |
| Revenue Growth, % | 0 | -5.07 | 26.92 | -1.22 | 47.89 | 17.13 | 17.13 | 17.13 | 17.13 | 17.13 |
| EBITDA | 148.1 | -1,018.7 | -528.8 | 249.9 | 1,072.1 | -224.6 | -263.1 | -308.2 | -361.0 | -422.8 |
| EBITDA, % | 4.76 | -34.49 | -14.11 | 6.75 | 19.58 | -3.5 | -3.5 | -3.5 | -3.5 | -3.5 |
| Depreciation | 54.2 | 78.0 | 89.2 | 158.1 | 56.0 | 154.6 | 181.1 | 212.2 | 248.5 | 291.1 |
| Depreciation, % | 1.74 | 2.64 | 2.38 | 4.27 | 1.02 | 2.41 | 2.41 | 2.41 | 2.41 | 2.41 |
| EBIT | 94.0 | -1,096.7 | -618.0 | 91.9 | 1,016.0 | -379.3 | -444.2 | -520.3 | -609.5 | -713.9 |
| EBIT, % | 3.02 | -37.13 | -16.49 | 2.48 | 18.55 | -5.91 | -5.91 | -5.91 | -5.91 | -5.91 |
| Total Cash | 2,534.2 | 4,323.4 | 3,921.0 | 3,664.9 | 3,179.5 | 5,625.0 | 6,588.6 | 7,717.2 | 9,039.2 | 10,587.6 |
| Total Cash, percent | .0 | .0 | .0 | .0 | .0 | .0 | .0 | .0 | .0 | .0 |
| Account Receivables | 326.8 | 244.2 | 272.5 | 313.3 | 364.3 | 528.0 | 618.5 | 724.4 | 848.5 | 993.8 |
| Account Receivables, % | 10.51 | 8.27 | 7.27 | 8.46 | 6.65 | 8.23 | 8.23 | 8.23 | 8.23 | 8.23 |
| Inventories | .0 | .0 | .0 | .0 | .0 | .0 | .0 | .0 | .0 | .0 |
| Inventories, % | 0 | 0 | 0 | 0 | 0 | 0 | 0 | 0 | 0 | 0 |
| Accounts Payable | 179.8 | 224.4 | 221.8 | 212.9 | 203.6 | 369.0 | 432.2 | 506.2 | 592.9 | 694.5 |
| Accounts Payable, % | 5.78 | 7.6 | 5.92 | 5.75 | 3.72 | 5.75 | 5.75 | 5.75 | 5.75 | 5.75 |
| Capital Expenditure | -79.2 | -100.2 | -40.5 | -18.0 | -30.2 | -103.3 | -121.0 | -141.8 | -166.1 | -194.5 |
| Capital Expenditure, % | -2.54 | -3.39 | -1.08 | -0.48555 | -0.55075 | -1.61 | -1.61 | -1.61 | -1.61 | -1.61 |
| Tax Rate, % | 13.24 | 13.24 | 13.24 | 13.24 | 13.24 | 13.24 | 13.24 | 13.24 | 13.24 | 13.24 |
| EBITAT | 8.0 | -991.0 | -611.0 | 253.4 | 881.5 | -291.7 | -341.7 | -400.2 | -468.7 | -549.0 |
| Depreciation | ||||||||||
| Changes in Account Receivables | ||||||||||
| Changes in Inventories | ||||||||||
| Changes in Accounts Payable | ||||||||||
| Capital Expenditure | ||||||||||
| UFCF | -164.0 | -886.1 | -593.2 | 343.8 | 847.1 | -238.7 | -308.8 | -361.7 | -423.7 | -496.3 |
| WACC, % | 12.26 | 12.31 | 12.32 | 12.32 | 12.31 | 12.3 | 12.3 | 12.3 | 12.3 | 12.3 |
| PV UFCF | ||||||||||
| SUM PV UFCF | -1,257.0 | |||||||||
| Long Term Growth Rate, % | 2.00 | |||||||||
| Free cash flow (T + 1) | -506 | |||||||||
| Terminal Value | -4,913 | |||||||||
| Present Terminal Value | -2,750 | |||||||||
| Enterprise Value | -4,007 | |||||||||
| Net Debt | -2,865 | |||||||||
| Equity Value | -1,142 | |||||||||
| Diluted Shares Outstanding, MM | 480 | |||||||||
| Equity Value Per Share | -2.38 |
What You Will Receive
- Adjustable Forecast Variables: Effortlessly modify assumptions (growth %, margins, WACC) to explore various scenarios.
- Comprehensive Market Data: XD Inc.’s (2400HK) financial data preloaded to enhance your analysis.
- Automated DCF Results: The model computes Net Present Value (NPV) and intrinsic value automatically for your convenience.
- Tailored and Professional Design: A sleek Excel model that accommodates your valuation requirements.
- Designed for Analysts and Investors: Perfect for testing forecasts, validating strategies, and optimizing your time.
Key Features
- Accurate XD Inc. Financials: Access precise pre-loaded historical data and future forecasts.
- Customizable Projection Parameters: Modify yellow-highlighted fields such as WACC, growth rates, and margins.
- Real-Time Calculations: Automatic updates for DCF, Net Present Value (NPV), and cash flow analyses.
- User-Friendly Dashboard: Clear charts and summaries designed to visualize your valuation outcomes.
- Designed for All Levels: An intuitive layout tailored for investors, CFOs, and consultants alike.
How It Works
- Download: Obtain the pre-configured Excel file containing XD Inc.'s (2400HK) financial data.
- Customize: Tailor your forecasts, such as revenue growth, EBITDA %, and WACC.
- Update Automatically: Watch as intrinsic value and NPV calculations refresh in real-time.
- Test Scenarios: Generate various projections and instantly compare the results.
- Make Decisions: Leverage the valuation outcomes to inform your investment strategy.
Why Opt for the XD Inc. Calculator?
- Precision: Utilizes authentic XD Inc. financials for reliable data.
- Versatility: Crafted for users to experiment with and adjust inputs effortlessly.
- Efficiency: Eliminate the need to create a DCF model from the ground up.
- Expert-Level: Engineered with the accuracy and usability expected from top financial executives.
- Accessible: Simple to navigate, making it suitable for those with minimal financial modeling skills.
Who Should Consider Using Our Services?
- Finance Students: Master valuation techniques and apply them to real-world data specific to XD Inc. (2400HK).
- Academics: Integrate professional models into your research or teaching related to XD Inc. (2400HK).
- Investors: Validate your own hypotheses and evaluate valuation results for XD Inc. (2400HK).
- Analysts: Enhance your efficiency with our pre-built, customizable DCF model tailored for XD Inc. (2400HK).
- Small Business Owners: Discover how large public companies like XD Inc. (2400HK) are analyzed in depth.
Contents of the Template
- Historical Data: Encompasses XD Inc.'s (2400HK) previous financial performance and baseline forecasts.
- DCF and Levered DCF Models: Comprehensive templates for assessing the intrinsic value of XD Inc. (2400HK).
- WACC Sheet: Pre-configured calculations for the Weighted Average Cost of Capital.
- Editable Inputs: Adjust key variables such as growth rates, EBITDA percentages, and CAPEX assumptions.
- Quarterly and Annual Statements: A thorough analysis of XD Inc.'s (2400HK) financial data.
- Interactive Dashboard: Dynamically visualize valuation outcomes and forecasts.
Disclaimer
All information, articles, and product details provided on this website are for general informational and educational purposes only. We do not claim any ownership over, nor do we intend to infringe upon, any trademarks, copyrights, logos, brand names, or other intellectual property mentioned or depicted on this site. Such intellectual property remains the property of its respective owners, and any references here are made solely for identification or informational purposes, without implying any affiliation, endorsement, or partnership.
We make no representations or warranties, express or implied, regarding the accuracy, completeness, or suitability of any content or products presented. Nothing on this website should be construed as legal, tax, investment, financial, medical, or other professional advice. In addition, no part of this site—including articles or product references—constitutes a solicitation, recommendation, endorsement, advertisement, or offer to buy or sell any securities, franchises, or other financial instruments, particularly in jurisdictions where such activity would be unlawful.
All content is of a general nature and may not address the specific circumstances of any individual or entity. It is not a substitute for professional advice or services. Any actions you take based on the information provided here are strictly at your own risk. You accept full responsibility for any decisions or outcomes arising from your use of this website and agree to release us from any liability in connection with your use of, or reliance upon, the content or products found herein.