
|
China Pacific Insurance Co., Ltd. (2601.HK) Valation DCF |
Entièrement Modifiable: Adapté À Vos Besoins Dans Excel Ou Sheets
Conception Professionnelle: Modèles Fiables Et Conformes Aux Normes Du Secteur
Pré-Construits Pour Une Utilisation Rapide Et Efficace
Compatible MAC/PC, entièrement débloqué
Aucune Expertise N'Est Requise; Facile À Suivre
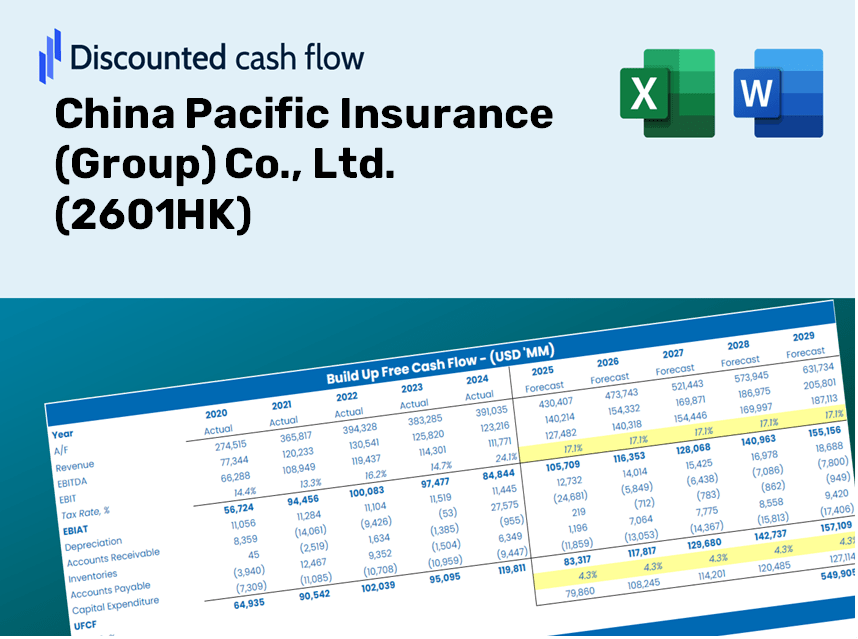
China Pacific Insurance (Group) Co., Ltd. (2601.HK) Bundle
Que vous soyez un investisseur ou un analyste, cette calculatrice DCF de DCF est votre outil de réévaluation précis. Préchargé avec des données réelles de l'assurance-pacifique chinoise, vous pouvez ajuster les prévisions et observer les effets en temps réel.
Discounted Cash Flow (DCF) - (USD MM)
| Year | AY1 2020 |
AY2 2021 |
AY3 2022 |
AY4 2023 |
AY5 2024 |
FY1 2025 |
FY2 2026 |
FY3 2027 |
FY4 2028 |
FY5 2029 |
|---|---|---|---|---|---|---|---|---|---|---|
| Revenue | 458,368.2 | 478,238.9 | 360,507.4 | 352,526.0 | 440,437.3 | 443,125.0 | 445,829.1 | 448,549.7 | 451,287.0 | 454,040.9 |
| Revenue Growth, % | 0 | 4.34 | -24.62 | -2.21 | 24.94 | 0.61024 | 0.61024 | 0.61024 | 0.61024 | 0.61024 |
| EBITDA | 40,598.4 | 42,487.7 | 351,689.9 | 345,057.5 | 65,981.4 | 202,204.8 | 203,438.8 | 204,680.2 | 205,929.3 | 207,185.9 |
| EBITDA, % | 8.86 | 8.88 | 97.55 | 97.88 | 14.98 | 45.63 | 45.63 | 45.63 | 45.63 | 45.63 |
| Depreciation | 4,825.2 | 4,967.7 | 5,109.0 | 5,298.6 | 5,090.4 | 5,465.9 | 5,499.2 | 5,532.8 | 5,566.6 | 5,600.5 |
| Depreciation, % | 1.05 | 1.04 | 1.42 | 1.5 | 1.16 | 1.23 | 1.23 | 1.23 | 1.23 | 1.23 |
| EBIT | 35,773.2 | 37,520.0 | 346,580.8 | 339,758.9 | 60,891.0 | 196,739.0 | 197,939.5 | 199,147.4 | 200,362.7 | 201,585.4 |
| EBIT, % | 7.8 | 7.85 | 96.14 | 96.38 | 13.83 | 44.4 | 44.4 | 44.4 | 44.4 | 44.4 |
| Total Cash | 676,203.8 | 742,932.6 | 819,966.0 | 33,901.4 | 32,172.1 | 280,871.5 | 282,585.5 | 284,309.9 | 286,044.9 | 287,790.4 |
| Total Cash, percent | .0 | .0 | .0 | .0 | .0 | .0 | .0 | .0 | .0 | .0 |
| Account Receivables | .0 | .0 | .0 | .0 | .0 | .0 | .0 | .0 | .0 | .0 |
| Account Receivables, % | 0 | 0 | 0 | 0 | 0 | 0 | 0 | 0 | 0 | 0 |
| Inventories | .0 | .0 | .0 | .0 | .0 | .0 | .0 | .0 | .0 | .0 |
| Inventories, % | 0 | 0 | 0 | 0 | 0 | 0 | 0 | 0 | 0 | 0 |
| Accounts Payable | 29,946.3 | 31,960.5 | 20,722.2 | .0 | .0 | 16,807.1 | 16,909.6 | 17,012.8 | 17,116.7 | 17,221.1 |
| Accounts Payable, % | 6.53 | 6.68 | 5.75 | 0 | 0 | 3.79 | 3.79 | 3.79 | 3.79 | 3.79 |
| Capital Expenditure | -3,975.9 | -4,041.6 | -9,969.3 | -4,370.4 | -4,249.9 | -5,922.4 | -5,958.5 | -5,994.9 | -6,031.5 | -6,068.3 |
| Capital Expenditure, % | -0.8674 | -0.84511 | -2.77 | -1.24 | -0.96492 | -1.34 | -1.34 | -1.34 | -1.34 | -1.34 |
| Tax Rate, % | 19.08 | 19.08 | 19.08 | 19.08 | 19.08 | 19.08 | 19.08 | 19.08 | 19.08 | 19.08 |
| EBITAT | 30,078.9 | 32,692.9 | 304,958.2 | 289,391.2 | 49,271.2 | 167,346.2 | 168,367.4 | 169,394.9 | 170,428.6 | 171,468.6 |
| Depreciation | ||||||||||
| Changes in Account Receivables | ||||||||||
| Changes in Inventories | ||||||||||
| Changes in Accounts Payable | ||||||||||
| Capital Expenditure | ||||||||||
| UFCF | 60,874.5 | 35,633.2 | 288,859.5 | 269,597.2 | 50,111.8 | 183,696.8 | 168,010.7 | 169,036.0 | 170,067.5 | 171,105.3 |
| WACC, % | 6.6 | 6.61 | 6.61 | 6.6 | 6.6 | 6.6 | 6.6 | 6.6 | 6.6 | 6.6 |
| PV UFCF | ||||||||||
| SUM PV UFCF | 715,642.9 | |||||||||
| Long Term Growth Rate, % | 2.00 | |||||||||
| Free cash flow (T + 1) | 174,527 | |||||||||
| Terminal Value | 3,790,725 | |||||||||
| Present Terminal Value | 2,753,299 | |||||||||
| Enterprise Value | 3,468,942 | |||||||||
| Net Debt | -17,917 | |||||||||
| Equity Value | 3,486,859 | |||||||||
| Diluted Shares Outstanding, MM | 9,627 | |||||||||
| Equity Value Per Share | 362.18 |
Benefits You Will Receive
- Authentic 2601HK Financials: Access to both historical and projected data for precise valuation.
- Customizable Variables: Adjust parameters like WACC, tax rates, revenue growth, and capital expenditures.
- Dynamic Calculations: Get real-time calculations of intrinsic value and NPV.
- Scenario Testing: Explore various scenarios to assess the future performance of China Pacific Insurance.
- User-Friendly Design: Designed for industry professionals but easy for novices to navigate.
Key Features
- 🔍 Real-Life 2601HK Financials: Pre-filled historical and projected data for China Pacific Insurance (Group) Co., Ltd.
- ✏️ Fully Customizable Inputs: Adjust all critical parameters (yellow cells) such as WACC, growth %, and tax rates.
- 📊 Professional DCF Valuation: Integrated formulas calculate the intrinsic value of China Pacific Insurance using the Discounted Cash Flow method.
- ⚡ Instant Results: Visualize the valuation of China Pacific Insurance immediately after any adjustments.
- Scenario Analysis: Evaluate and compare results for different financial assumptions side-by-side.
How It Works
- Step 1: Download the Excel file.
- Step 2: Examine the pre-filled data for China Pacific Insurance (Group) Co., Ltd. (2601HK) including historical and projected figures.
- Step 3: Modify key assumptions (highlighted in yellow) based on your analysis.
- Step 4: Observe the automatic recalculations for the intrinsic value of China Pacific Insurance (Group) Co., Ltd. (2601HK).
- Step 5: Utilize the results for making investment decisions or for reporting purposes.
Why Choose This Calculator for China Pacific Insurance (Group) Co., Ltd. (2601HK)?
- All-in-One Solution: Provides DCF, WACC, and financial ratio analyses within a single tool.
- Flexible Variables: Modify the yellow-highlighted fields to explore different financial scenarios.
- In-Depth Analysis: Automatically computes the intrinsic value and Net Present Value for China Pacific Insurance.
- Preloaded Information: Historical and projected data offer reliable baselines for calculations.
- High-Quality Standards: Perfect for financial analysts, investors, and business consultants alike.
Who Should Consider This Product?
- Investors: Accurately assess China Pacific Insurance’s (2601HK) fair value before making investment choices.
- CFOs: Utilize a high-quality DCF model for comprehensive financial reporting and analysis.
- Consultants: Quickly modify the template for tailored valuation reports for clients.
- Entrepreneurs: Acquire insights into the financial modeling practices of industry leaders.
- Educators: Employ this resource as a teaching aid to illustrate valuation techniques.
Contents of the Template
- Preloaded 2601HK Data: Historical and projected financial information, including revenue, EBIT, and capital expenditures.
- DCF and WACC Models: Expert-level sheets designed for calculating intrinsic value and Weighted Average Cost of Capital.
- Editable Inputs: Yellow-highlighted cells available for modifying revenue growth, tax rates, and discount rates.
- Financial Statements: Detailed annual and quarterly financials for thorough analysis.
- Key Ratios: Metrics assessing profitability, leverage, and efficiency to gauge performance.
- Dashboard and Charts: Visual representations of valuation results and underlying assumptions.
Disclaimer
All information, articles, and product details provided on this website are for general informational and educational purposes only. We do not claim any ownership over, nor do we intend to infringe upon, any trademarks, copyrights, logos, brand names, or other intellectual property mentioned or depicted on this site. Such intellectual property remains the property of its respective owners, and any references here are made solely for identification or informational purposes, without implying any affiliation, endorsement, or partnership.
We make no representations or warranties, express or implied, regarding the accuracy, completeness, or suitability of any content or products presented. Nothing on this website should be construed as legal, tax, investment, financial, medical, or other professional advice. In addition, no part of this site—including articles or product references—constitutes a solicitation, recommendation, endorsement, advertisement, or offer to buy or sell any securities, franchises, or other financial instruments, particularly in jurisdictions where such activity would be unlawful.
All content is of a general nature and may not address the specific circumstances of any individual or entity. It is not a substitute for professional advice or services. Any actions you take based on the information provided here are strictly at your own risk. You accept full responsibility for any decisions or outcomes arising from your use of this website and agree to release us from any liability in connection with your use of, or reliance upon, the content or products found herein.