
|
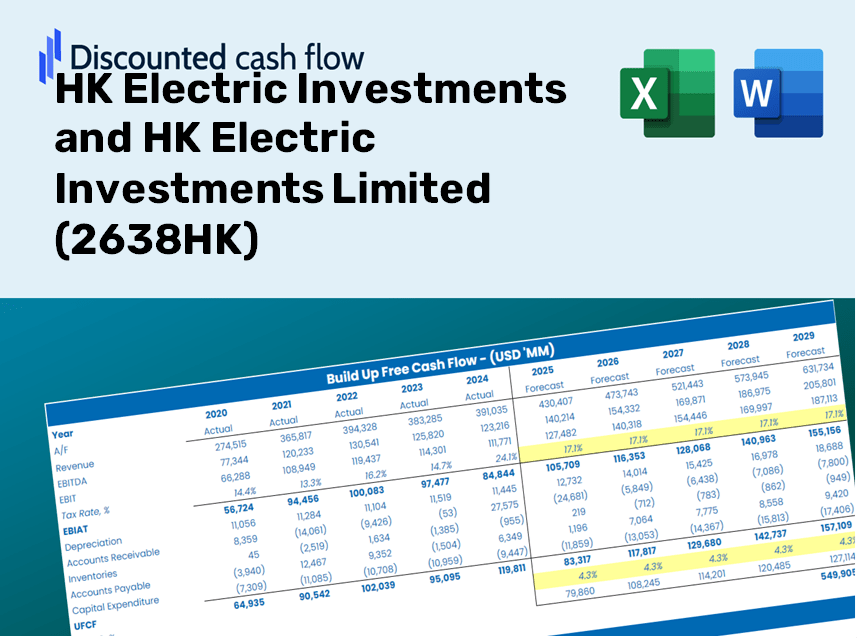
HK Electric Investments et HK Electric Investments Limited (2638.HK) DCF Valuation |
Entièrement Modifiable: Adapté À Vos Besoins Dans Excel Ou Sheets
Conception Professionnelle: Modèles Fiables Et Conformes Aux Normes Du Secteur
Pré-Construits Pour Une Utilisation Rapide Et Efficace
Compatible MAC/PC, entièrement débloqué
Aucune Expertise N'Est Requise; Facile À Suivre
HK Electric Investments and HK Electric Investments Limited (2638.HK) Bundle
Évaluez les perspectives financières de HK Electric Investments et HK Electric Investments Limited comme un professionnel! Cette calculatrice DCF (2638HK) fournit des données financières pré-remplies ainsi que la flexibilité pour modifier la croissance des revenus, le WACC, les marges et d'autres hypothèses cruciales pour s'aligner sur vos projections.
Benefits of Your Purchase
- Customizable Excel Template: An adaptable Excel-based DCF Calculator featuring pre-populated financials for HK Electric Investments (2638HK).
- Comprehensive Data: Access to historical performance metrics and forward-looking projections (highlighted in the yellow cells).
- Projection Flexibility: Adjust key assumptions such as revenue growth, EBITDA margins, and WACC with ease.
- Instant Calculations: Quickly assess how your inputs influence the valuation of HK Electric Investments (2638HK).
- Professional Resource: Crafted for investors, CFOs, consultants, and financial analysts alike.
- Intuitive Design: Organized for straightforward navigation and usability, complete with step-by-step guidance.
Key Features
- Pre-Loaded Data: HK Electric Investments’ historical financial statements and pre-filled forecasts.
- Fully Adjustable Inputs: Customize WACC, tax rates, revenue growth, and EBITDA margins.
- Instant Results: View HK Electric Investments' intrinsic value recalculated in real time.
- Clear Visual Outputs: Dashboard charts showcase valuation results and essential metrics.
- Built for Accuracy: A professional tool designed for analysts, investors, and finance professionals.
How It Functions
- Download the Template: Gain immediate access to the Excel-based HK Electric DCF Calculator.
- Enter Your Assumptions: Modify the yellow-highlighted fields for growth rates, WACC, margins, and additional inputs.
- Instant Calculations: The model will automatically refresh HK Electric's intrinsic value.
- Test Scenarios: Explore various assumptions to assess possible changes in valuation.
- Analyze and Decide: Utilize the outcomes to inform your investment or financial analysis.
Why Opt for This Calculator?
- User-Friendly Interface: Crafted for both novices and seasoned professionals.
- Customizable Inputs: Easily adjust parameters to suit your financial analysis.
- Real-Time Feedback: Observe immediate changes to HK Electric Investments' valuation as you update inputs.
- Pre-Loaded Data: Comes equipped with HK Electric's actual financial statistics for swift evaluations.
- Relied Upon by Experts: Trusted by investors and analysts to enhance decision-making.
Who Should Benefit from This Product?
- Investors: Accurately assess the fair value of HK Electric Investments Limited (2638HK) prior to making investment choices.
- CFOs: Utilize a professional-grade DCF model for comprehensive financial reporting and analysis.
- Consultants: Efficiently customize the template for client valuation reports.
- Entrepreneurs: Acquire insights into the financial modeling practices of leading companies in the industry.
- Educators: Implement it as a teaching resource to illustrate various valuation methodologies.
Contents of the Template
- Thorough DCF Model: An editable template equipped with in-depth valuation calculations.
- Actual Financial Data: Historical and projected financials of HK Electric Investments and HK Electric Investments Limited (2638HK) included for analysis.
- Adjustable Parameters: Modify WACC, growth rates, and tax assumptions to explore different scenarios.
- Financial Statements: Comprehensive annual and quarterly breakdowns for enhanced analysis.
- Key Financial Ratios: Integrated assessments for profitability, efficiency, and financial leverage.
- Visual Dashboard: Charts and tables that present clear and actionable insights.
Disclaimer
All information, articles, and product details provided on this website are for general informational and educational purposes only. We do not claim any ownership over, nor do we intend to infringe upon, any trademarks, copyrights, logos, brand names, or other intellectual property mentioned or depicted on this site. Such intellectual property remains the property of its respective owners, and any references here are made solely for identification or informational purposes, without implying any affiliation, endorsement, or partnership.
We make no representations or warranties, express or implied, regarding the accuracy, completeness, or suitability of any content or products presented. Nothing on this website should be construed as legal, tax, investment, financial, medical, or other professional advice. In addition, no part of this site—including articles or product references—constitutes a solicitation, recommendation, endorsement, advertisement, or offer to buy or sell any securities, franchises, or other financial instruments, particularly in jurisdictions where such activity would be unlawful.
All content is of a general nature and may not address the specific circumstances of any individual or entity. It is not a substitute for professional advice or services. Any actions you take based on the information provided here are strictly at your own risk. You accept full responsibility for any decisions or outcomes arising from your use of this website and agree to release us from any liability in connection with your use of, or reliance upon, the content or products found herein.