
|
Fields Corporation (2767.T) Évaluation DCF |
Entièrement Modifiable: Adapté À Vos Besoins Dans Excel Ou Sheets
Conception Professionnelle: Modèles Fiables Et Conformes Aux Normes Du Secteur
Pré-Construits Pour Une Utilisation Rapide Et Efficace
Compatible MAC/PC, entièrement débloqué
Aucune Expertise N'Est Requise; Facile À Suivre
Fields Corporation (2767.T) Bundle
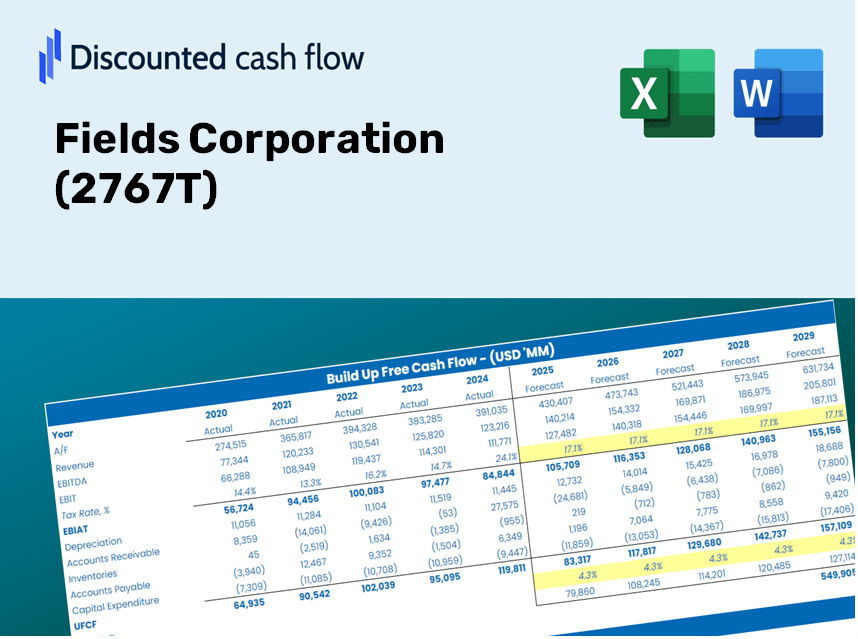
Vous cherchez à évaluer la valeur intrinsèque de Fields Corporation? Notre (2767T) Calculator DCF intègre des données réelles avec des fonctionnalités de personnalisation complètes, vous permettant d'affiner vos prévisions et d'améliorer vos choix d'investissement.
Discounted Cash Flow (DCF) - (USD MM)
| Year | AY1 2020 |
AY2 2021 |
AY3 2022 |
AY4 2023 |
AY5 2024 |
FY1 2025 |
FY2 2026 |
FY3 2027 |
FY4 2028 |
FY5 2029 |
|---|---|---|---|---|---|---|---|---|---|---|
| Revenue | 38,796.0 | 94,900.0 | 117,125.0 | 141,923.0 | 140,581.0 | 191,065.8 | 259,680.4 | 352,935.5 | 479,680.0 | 651,940.4 |
| Revenue Growth, % | 0 | 144.61 | 23.42 | 21.17 | -0.94558 | 35.91 | 35.91 | 35.91 | 35.91 | 35.91 |
| EBITDA | -1,642.0 | 5,071.0 | 12,250.0 | 15,175.0 | 17,817.0 | 13,350.3 | 18,144.5 | 24,660.5 | 33,516.5 | 45,552.8 |
| EBITDA, % | -4.23 | 5.34 | 10.46 | 10.69 | 12.67 | 6.99 | 6.99 | 6.99 | 6.99 | 6.99 |
| Depreciation | 1,153.0 | 989.0 | 1,041.0 | 1,306.0 | 1,460.0 | 2,622.1 | 3,563.7 | 4,843.5 | 6,582.8 | 8,946.8 |
| Depreciation, % | 2.97 | 1.04 | 0.88879 | 0.92022 | 1.04 | 1.37 | 1.37 | 1.37 | 1.37 | 1.37 |
| EBIT | -2,795.0 | 4,082.0 | 11,209.0 | 13,869.0 | 16,357.0 | 10,728.2 | 14,580.9 | 19,817.1 | 26,933.7 | 36,606.0 |
| EBIT, % | -7.2 | 4.3 | 9.57 | 9.77 | 11.64 | 5.61 | 5.61 | 5.61 | 5.61 | 5.61 |
| Total Cash | 24,610.0 | 32,404.0 | 36,597.0 | 34,914.0 | 30,954.0 | 67,043.1 | 91,119.3 | 123,841.7 | 168,315.1 | 228,759.6 |
| Total Cash, percent | .0 | .0 | .0 | .0 | .0 | .0 | .0 | .0 | .0 | .0 |
| Account Receivables | 5,321.0 | 12,900.0 | 12,531.0 | 13,104.0 | 17,143.0 | 22,712.0 | 30,868.2 | 41,953.4 | 57,019.5 | 77,496.1 |
| Account Receivables, % | 13.72 | 13.59 | 10.7 | 9.23 | 12.19 | 11.89 | 11.89 | 11.89 | 11.89 | 11.89 |
| Inventories | 6,190.0 | 8,300.0 | 5,972.0 | 12,377.0 | 18,713.0 | 19,806.7 | 26,919.6 | 36,586.9 | 49,725.8 | 67,583.1 |
| Inventories, % | 15.96 | 8.75 | 5.1 | 8.72 | 13.31 | 10.37 | 10.37 | 10.37 | 10.37 | 10.37 |
| Accounts Payable | 3,610.0 | 13,128.0 | 12,402.0 | 10,961.0 | 14,950.0 | 19,903.3 | 27,050.9 | 36,765.2 | 49,968.2 | 67,912.5 |
| Accounts Payable, % | 9.31 | 13.83 | 10.59 | 7.72 | 10.63 | 10.42 | 10.42 | 10.42 | 10.42 | 10.42 |
| Capital Expenditure | -586.0 | -1,186.0 | -1,343.0 | -1,762.0 | -1,101.0 | -2,266.6 | -3,080.6 | -4,186.9 | -5,690.5 | -7,734.0 |
| Capital Expenditure, % | -1.51 | -1.25 | -1.15 | -1.24 | -0.78318 | -1.19 | -1.19 | -1.19 | -1.19 | -1.19 |
| Tax Rate, % | 31.34 | 31.34 | 31.34 | 31.34 | 31.34 | 31.34 | 31.34 | 31.34 | 31.34 | 31.34 |
| EBITAT | -3,317.9 | 2,559.4 | 8,281.6 | 11,744.1 | 11,231.1 | 8,366.4 | 11,370.9 | 15,454.3 | 21,004.2 | 28,547.1 |
| Depreciation | ||||||||||
| Changes in Account Receivables | ||||||||||
| Changes in Inventories | ||||||||||
| Changes in Accounts Payable | ||||||||||
| Capital Expenditure | ||||||||||
| UFCF | -10,651.9 | 2,191.4 | 9,950.6 | 2,869.1 | 5,204.1 | 7,012.4 | 3,732.4 | 5,072.8 | 6,894.5 | 9,370.4 |
| WACC, % | 6.6 | 6.49 | 6.52 | 6.55 | 6.51 | 6.53 | 6.53 | 6.53 | 6.53 | 6.53 |
| PV UFCF | ||||||||||
| SUM PV UFCF | 26,246.9 | |||||||||
| Long Term Growth Rate, % | 0.50 | |||||||||
| Free cash flow (T + 1) | 9,417 | |||||||||
| Terminal Value | 156,063 | |||||||||
| Present Terminal Value | 113,725 | |||||||||
| Enterprise Value | 139,972 | |||||||||
| Net Debt | -19,814 | |||||||||
| Equity Value | 159,786 | |||||||||
| Diluted Shares Outstanding, MM | 63 | |||||||||
| Equity Value Per Share | 2,553.30 |
What You Will Receive
- Authentic Fields Data: Comprehensive financials – from revenue to EBIT – derived from actual and forecasted metrics.
- Complete Customization: Modify all key parameters (yellow cells) such as WACC, growth %, and tax rates as needed.
- Real-Time Valuation Adjustments: Automatic updates to evaluate the effects of changes on Fields Corporation's fair value.
- Flexible Excel Template: Designed for swift modifications, scenario analysis, and in-depth projections.
- Efficient and Precise: Avoid starting from scratch while ensuring accuracy and adaptability.
Key Features
- Comprehensive Fields Data: Pre-populated with Fields Corporation's (2767T) historical performance metrics and future projections.
- Fully Customizable Parameters: Tailor revenue growth, profit margins, weighted average cost of capital (WACC), tax rates, and capital expenditures to your needs.
- Interactive Valuation Model: Real-time updates to Net Present Value (NPV) and intrinsic value based on your customized inputs.
- Scenario Analysis: Develop various forecast scenarios to evaluate different valuation possibilities.
- User-Friendly Interface: Intuitive, organized, and suitable for both seasoned professionals and newcomers.
How It Functions
- Download: Obtain the pre-formatted Excel file containing Fields Corporation’s financial information.
- Adapt: Modify projections, such as revenue growth, EBITDA %, and WACC.
- Real-Time Updates: The calculations for intrinsic value and NPV refresh dynamically.
- Scenario Testing: Develop various forecasts and instantly analyze different results.
- Strategic Decisions: Leverage the valuation findings to inform your investment decisions.
Why Opt for Fields Corporation’s Calculator?
- All-in-One Solution: Combines DCF, WACC, and financial ratio analyses into a single platform.
- Flexible Inputs: Modify the yellow-highlighted fields to explore different scenarios.
- In-Depth Analysis: Automatically computes the intrinsic value and Net Present Value of Fields Corporation (2767T).
- Preloaded Information: Historical and projected data provide reliable starting points.
- High-Quality Standards: Perfect for financial analysts, investors, and business consultants.
Who Can Benefit from Fields Corporation (2767T)?
- Institutional Investors: Create comprehensive and trustworthy valuation models for thorough portfolio assessment.
- Finance Departments: Evaluate valuation scenarios to inform corporate strategy and decision-making.
- Financial Consultants and Advisors: Deliver precise valuation insights to clients involved with Fields Corporation (2767T).
- Academic Professionals and Students: Utilize real-world data for hands-on practice and instruction in financial modeling.
- Technology Aficionados: Gain insights into how tech firms, such as Fields Corporation (2767T), are appraised in the marketplace.
Contents of the Template
- Comprehensive DCF Model: An editable template featuring in-depth valuation calculations.
- Real-World Data: Fields Corporation’s (2767T) historical and projected financials preloaded for thorough analysis.
- Customizable Parameters: Modify WACC, growth rates, and tax assumptions to explore various scenarios.
- Financial Statements: Complete annual and quarterly breakdowns for enhanced understanding.
- Key Ratios: Integrated analysis for assessing profitability, efficiency, and leverage.
- Dashboard with Visual Outputs: Graphs and tables that present clear and actionable insights.
Disclaimer
All information, articles, and product details provided on this website are for general informational and educational purposes only. We do not claim any ownership over, nor do we intend to infringe upon, any trademarks, copyrights, logos, brand names, or other intellectual property mentioned or depicted on this site. Such intellectual property remains the property of its respective owners, and any references here are made solely for identification or informational purposes, without implying any affiliation, endorsement, or partnership.
We make no representations or warranties, express or implied, regarding the accuracy, completeness, or suitability of any content or products presented. Nothing on this website should be construed as legal, tax, investment, financial, medical, or other professional advice. In addition, no part of this site—including articles or product references—constitutes a solicitation, recommendation, endorsement, advertisement, or offer to buy or sell any securities, franchises, or other financial instruments, particularly in jurisdictions where such activity would be unlawful.
All content is of a general nature and may not address the specific circumstances of any individual or entity. It is not a substitute for professional advice or services. Any actions you take based on the information provided here are strictly at your own risk. You accept full responsibility for any decisions or outcomes arising from your use of this website and agree to release us from any liability in connection with your use of, or reliance upon, the content or products found herein.