
|
Ajinomoto Co., Inc. (2802.T) Évaluation DCF |
Entièrement Modifiable: Adapté À Vos Besoins Dans Excel Ou Sheets
Conception Professionnelle: Modèles Fiables Et Conformes Aux Normes Du Secteur
Pré-Construits Pour Une Utilisation Rapide Et Efficace
Compatible MAC/PC, entièrement débloqué
Aucune Expertise N'Est Requise; Facile À Suivre
Ajinomoto Co., Inc. (2802.T) Bundle
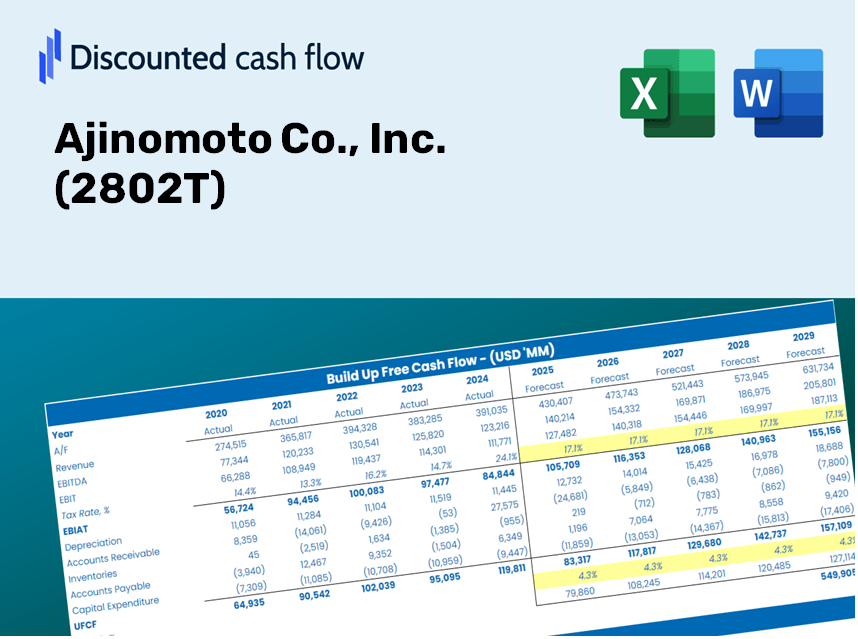
Optimisez votre temps et améliorez la précision avec notre (2802T) Calculator DCF! En utilisant des données réelles d'Ajinomoto Co., Inc. et des hypothèses personnalisables, cet outil vous permet de prévoir, analyser et valoriser Ajinomoto comme un investisseur chevronné.
Benefits You Will Receive
- Authentic AJIN Financial Data: Pre-loaded with Ajinomoto's historical and forecasted data for accurate assessments.
- Customizable Template: Easily adjust crucial inputs such as revenue growth, WACC, and EBITDA percentage.
- Instant Calculations: Watch Ajinomoto’s intrinsic value refresh immediately in response to your modifications.
- Expert Valuation Tool: Created for investors, analysts, and consultants aiming for reliable DCF results.
- Intuitive Design: Streamlined layout and straightforward guidance suitable for all skill levels.
Key Features
- Comprehensive DCF Calculator: Features detailed unlevered and levered DCF valuation models tailored for Ajinomoto Co., Inc. (2802T).
- WACC Calculator: Offers a pre-configured Weighted Average Cost of Capital sheet with options for user-defined inputs.
- Customizable Forecast Assumptions: Adjust parameters such as growth rates, capital expenditures, and discount rates as needed.
- Integrated Financial Ratios: Evaluate profitability, leverage, and efficiency ratios specific to Ajinomoto Co., Inc. (2802T).
- Interactive Dashboard and Charts: Provides visual representations of essential valuation metrics for straightforward analysis.
How It Works
- Download: Access the ready-to-use Excel file featuring Ajinomoto Co., Inc.’s (2802T) financial data.
- Customize: Modify forecasts such as revenue growth, EBITDA %, and WACC to fit your analysis.
- Update Automatically: Enjoy real-time updates for intrinsic value and NPV calculations.
- Test Scenarios: Generate various projections and quickly compare the results.
- Make Decisions: Leverage the valuation insights to inform your investment strategies.
Why Choose This Calculator for Ajinomoto Co., Inc. (2802T)?
- Precise Financial Insights: Utilize authentic Ajinomoto financial data for dependable valuation outcomes.
- Customizable Options: Modify essential factors such as growth projections, WACC, and tax rates to align with your forecasts.
- Efficiency Boost: Ready-to-use calculations allow you to bypass the initial setup phase.
- Expert-Level Resource: Tailored for investors, analysts, and consultants in the field.
- Easy to Use: Simple design and clear, step-by-step guidance make it accessible for everyone.
Who Can Benefit from This Product?
- Investors: Accurately assess Ajinomoto Co., Inc.'s (2802T) fair value prior to making investment choices.
- CFOs: Utilize a professional-grade DCF model for comprehensive financial reporting and analysis.
- Consultants: Effortlessly customize the template for valuation reports tailored to clients.
- Entrepreneurs: Acquire valuable insights into financial modeling practices used by leading corporations.
- Educators: Leverage this tool to illustrate various valuation methodologies in the classroom.
Contents of the Template
- Pre-Filled DCF Model: Ajinomoto Co., Inc.'s (2802T) financial data preloaded for immediate access.
- WACC Calculator: Comprehensive calculations for the Weighted Average Cost of Capital.
- Financial Ratios: Assess Ajinomoto's (2802T) profitability, leverage, and operational efficiency.
- Editable Inputs: Adjust assumptions like growth rates, margins, and CAPEX to suit your analysis.
- Financial Statements: Access annual and quarterly reports for in-depth evaluation.
- Interactive Dashboard: Effortlessly visualize key valuation metrics and outcomes.
Disclaimer
All information, articles, and product details provided on this website are for general informational and educational purposes only. We do not claim any ownership over, nor do we intend to infringe upon, any trademarks, copyrights, logos, brand names, or other intellectual property mentioned or depicted on this site. Such intellectual property remains the property of its respective owners, and any references here are made solely for identification or informational purposes, without implying any affiliation, endorsement, or partnership.
We make no representations or warranties, express or implied, regarding the accuracy, completeness, or suitability of any content or products presented. Nothing on this website should be construed as legal, tax, investment, financial, medical, or other professional advice. In addition, no part of this site—including articles or product references—constitutes a solicitation, recommendation, endorsement, advertisement, or offer to buy or sell any securities, franchises, or other financial instruments, particularly in jurisdictions where such activity would be unlawful.
All content is of a general nature and may not address the specific circumstances of any individual or entity. It is not a substitute for professional advice or services. Any actions you take based on the information provided here are strictly at your own risk. You accept full responsibility for any decisions or outcomes arising from your use of this website and agree to release us from any liability in connection with your use of, or reliance upon, the content or products found herein.