
|
Zijin Mining Group Company Limited (2899.HK) Valation DCF |
Entièrement Modifiable: Adapté À Vos Besoins Dans Excel Ou Sheets
Conception Professionnelle: Modèles Fiables Et Conformes Aux Normes Du Secteur
Pré-Construits Pour Une Utilisation Rapide Et Efficace
Compatible MAC/PC, entièrement débloqué
Aucune Expertise N'Est Requise; Facile À Suivre
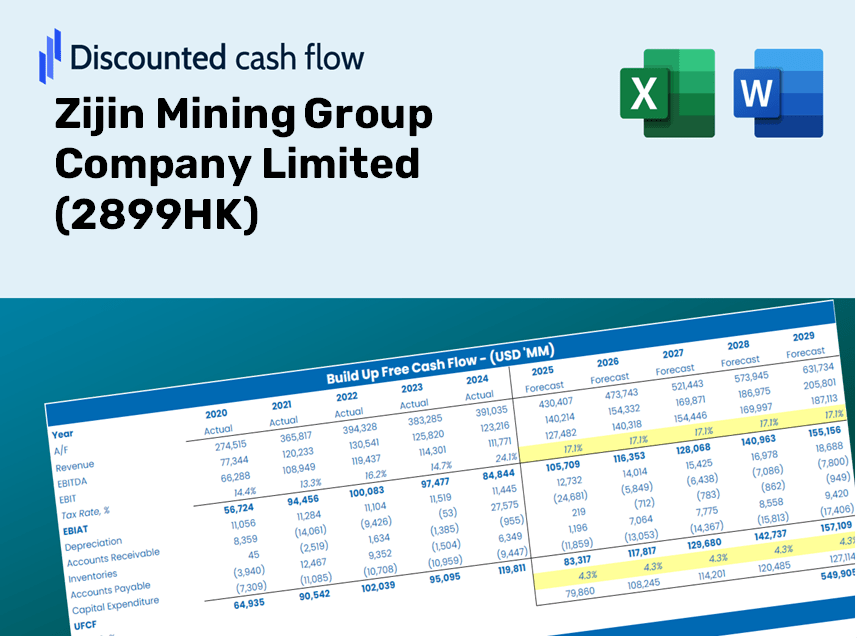
Zijin Mining Group Company Limited (2899.HK) Bundle
Que vous soyez un investisseur ou un analyste, cette calculatrice DCF (2899HK) est votre outil essentiel pour une évaluation précise. Chargé de données réelles de Zijin Mining Group Company Limited, vous pouvez modifier les prévisions et observer instantanément l'impact.
Discounted Cash Flow (DCF) - (USD MM)
| Year | AY1 2020 |
AY2 2021 |
AY3 2022 |
AY4 2023 |
AY5 2024 |
FY1 2025 |
FY2 2026 |
FY3 2027 |
FY4 2028 |
FY5 2029 |
|---|---|---|---|---|---|---|---|---|---|---|
| Revenue | 187,946.7 | 246,687.7 | 296,251.0 | 321,537.8 | 332,756.1 | 385,473.1 | 446,541.9 | 517,285.5 | 599,236.6 | 694,170.9 |
| Revenue Growth, % | 0 | 31.25 | 20.09 | 8.54 | 3.49 | 15.84 | 15.84 | 15.84 | 15.84 | 15.84 |
| EBITDA | 19,200.8 | 35,283.2 | 47,119.1 | 44,267.1 | 68,453.3 | 57,638.2 | 66,769.5 | 77,347.5 | 89,601.4 | 103,796.5 |
| EBITDA, % | 10.22 | 14.3 | 15.91 | 13.77 | 20.57 | 14.95 | 14.95 | 14.95 | 14.95 | 14.95 |
| Depreciation | 7,684.1 | 8,611.4 | 10,707.5 | 10,853.4 | 11,056.0 | 13,793.5 | 15,978.7 | 18,510.1 | 21,442.6 | 24,839.7 |
| Depreciation, % | 4.09 | 3.49 | 3.61 | 3.38 | 3.32 | 3.58 | 3.58 | 3.58 | 3.58 | 3.58 |
| EBIT | 11,516.7 | 26,671.8 | 36,411.5 | 33,413.8 | 57,397.3 | 43,844.7 | 50,790.9 | 58,837.4 | 68,158.8 | 78,956.8 |
| EBIT, % | 6.13 | 10.81 | 12.29 | 10.39 | 17.25 | 11.37 | 11.37 | 11.37 | 11.37 | 11.37 |
| Total Cash | 15,217.0 | 18,802.2 | 27,767.2 | 27,280.7 | 41,303.2 | 35,454.3 | 41,071.2 | 47,577.9 | 55,115.4 | 63,847.1 |
| Total Cash, percent | .0 | .0 | .0 | .0 | .0 | .0 | .0 | .0 | .0 | .0 |
| Account Receivables | 2,986.9 | 4,825.7 | 14,098.8 | 13,450.6 | 14,301.3 | 12,940.7 | 14,990.9 | 17,365.8 | 20,117.0 | 23,304.0 |
| Account Receivables, % | 1.59 | 1.96 | 4.76 | 4.18 | 4.3 | 3.36 | 3.36 | 3.36 | 3.36 | 3.36 |
| Inventories | 19,796.3 | 21,160.3 | 30,798.9 | 32,098.2 | 36,507.6 | 38,902.7 | 45,065.9 | 52,205.4 | 60,476.1 | 70,057.0 |
| Inventories, % | 10.53 | 8.58 | 10.4 | 9.98 | 10.97 | 10.09 | 10.09 | 10.09 | 10.09 | 10.09 |
| Accounts Payable | 7,074.7 | 8,588.2 | 14,786.8 | 17,845.8 | 22,824.8 | 19,001.0 | 22,011.2 | 25,498.4 | 29,538.0 | 34,217.5 |
| Accounts Payable, % | 3.76 | 3.48 | 4.99 | 5.55 | 6.86 | 4.93 | 4.93 | 4.93 | 4.93 | 4.93 |
| Capital Expenditure | -15,218.0 | -22,080.6 | -27,171.9 | -33,346.5 | -27,175.7 | -34,505.6 | -39,972.2 | -46,304.8 | -53,640.7 | -62,138.7 |
| Capital Expenditure, % | -8.1 | -8.95 | -9.17 | -10.37 | -8.17 | -8.95 | -8.95 | -8.95 | -8.95 | -8.95 |
| Tax Rate, % | 33.34 | 33.34 | 33.34 | 33.34 | 33.34 | 33.34 | 33.34 | 33.34 | 33.34 | 33.34 |
| EBITAT | 6,911.0 | 16,860.0 | 24,331.2 | 22,554.7 | 38,263.4 | 28,429.8 | 32,933.8 | 38,151.3 | 44,195.4 | 51,197.1 |
| Depreciation | ||||||||||
| Changes in Account Receivables | ||||||||||
| Changes in Inventories | ||||||||||
| Changes in Accounts Payable | ||||||||||
| Capital Expenditure | ||||||||||
| UFCF | -16,331.4 | 1,701.4 | -4,846.1 | 2,469.4 | 21,862.7 | 2,859.3 | 3,737.2 | 4,329.3 | 5,015.1 | 5,809.6 |
| WACC, % | 8.56 | 8.58 | 8.6 | 8.6 | 8.6 | 8.59 | 8.59 | 8.59 | 8.59 | 8.59 |
| PV UFCF | ||||||||||
| SUM PV UFCF | 16,638.9 | |||||||||
| Long Term Growth Rate, % | 2.00 | |||||||||
| Free cash flow (T + 1) | 5,926 | |||||||||
| Terminal Value | 89,950 | |||||||||
| Present Terminal Value | 59,579 | |||||||||
| Enterprise Value | 76,218 | |||||||||
| Net Debt | 107,723 | |||||||||
| Equity Value | -31,504 | |||||||||
| Diluted Shares Outstanding, MM | 27,035 | |||||||||
| Equity Value Per Share | -1.17 |
What You Will Receive
- Authentic Zijin Mining Data: Comprehensive financials – including revenue and EBIT – derived from real and estimated figures.
- Comprehensive Customization: Modify all essential parameters (yellow cells) such as WACC, growth rates, and tax percentages.
- Real-Time Valuation Adjustments: Automatic recalculations to assess the effects of changes on Zijin Mining’s fair value.
- Flexible Excel Template: Designed for swift edits, scenario analysis, and in-depth projections.
- Efficiency and Precision: Eliminate the need to build models from scratch while ensuring accuracy and adaptability.
Key Features
- Accurate Zijin Mining Financials: Gain access to reliable pre-loaded historical data and forward-looking projections for [2899HK].
- Tailorable Forecast Assumptions: Modify key inputs highlighted in yellow, such as WACC, growth rates, and profit margins.
- Real-Time Calculations: Experience automatic updates to DCF, Net Present Value (NPV), and cash flow assessments.
- User-Friendly Dashboard: Access clear charts and summaries for an intuitive understanding of your valuation outcomes.
- Suitable for All Skill Levels: A straightforward and user-friendly design catered to investors, CFOs, and consultants alike.
How It Works
- Step 1: Download the prebuilt Excel template featuring Zijin Mining's data included.
- Step 2: Review the pre-filled sheets to grasp the key performance indicators.
- Step 3: Adjust forecasts and assumptions in the editable yellow cells (WACC, growth, margins).
- Step 4: Instantly see recalculated results, including Zijin Mining's intrinsic value.
- Step 5: Use the outputs to make informed investment decisions or prepare reports.
Why Opt for the Zijin Mining Group Calculator?
- Time Efficient: Skip the hassle of building a DCF model from scratch – it's immediately available for use.
- Enhanced Accuracy: Dependable financial data and formulas help minimize valuation errors.
- Completely Customizable: Modify the model to align with your unique assumptions and projections.
- Simple to Analyze: Intuitive charts and outputs ensure results are straightforward to interpret.
- Endorsed by Professionals: Tailored for industry experts who prioritize precision and user-friendliness.
Who Can Benefit from This Product?
- Individual Investors: Make well-informed choices when buying or selling shares of Zijin Mining Group Company Limited (2899HK).
- Financial Analysts: Enhance your valuation processes with easy-to-use financial models tailored for Zijin Mining Group Company Limited (2899HK).
- Consultants: Provide clients with accurate and timely valuation insights related to Zijin Mining Group Company Limited (2899HK).
- Business Owners: Gain insights into the valuation of large firms like Zijin Mining Group Company Limited (2899HK) to inform your strategic decisions.
- Finance Students: Explore valuation techniques through real-world cases and data focusing on Zijin Mining Group Company Limited (2899HK).
Contents of the Template
- Preloaded 2899HK Data: Historical and forecasted financial metrics, including revenue, EBIT, and capital expenditures.
- DCF and WACC Models: Professional-grade spreadsheets for computing intrinsic value and Weighted Average Cost of Capital.
- Editable Inputs: Yellow-highlighted cells to modify revenue growth, tax rates, and discount rates.
- Financial Statements: Detailed annual and quarterly financial statements for thorough analysis.
- Key Ratios: Profitability, leverage, and efficiency ratios for performance evaluation.
- Dashboard and Charts: Visual representations of valuation results and underlying assumptions.
Disclaimer
All information, articles, and product details provided on this website are for general informational and educational purposes only. We do not claim any ownership over, nor do we intend to infringe upon, any trademarks, copyrights, logos, brand names, or other intellectual property mentioned or depicted on this site. Such intellectual property remains the property of its respective owners, and any references here are made solely for identification or informational purposes, without implying any affiliation, endorsement, or partnership.
We make no representations or warranties, express or implied, regarding the accuracy, completeness, or suitability of any content or products presented. Nothing on this website should be construed as legal, tax, investment, financial, medical, or other professional advice. In addition, no part of this site—including articles or product references—constitutes a solicitation, recommendation, endorsement, advertisement, or offer to buy or sell any securities, franchises, or other financial instruments, particularly in jurisdictions where such activity would be unlawful.
All content is of a general nature and may not address the specific circumstances of any individual or entity. It is not a substitute for professional advice or services. Any actions you take based on the information provided here are strictly at your own risk. You accept full responsibility for any decisions or outcomes arising from your use of this website and agree to release us from any liability in connection with your use of, or reliance upon, the content or products found herein.