
|
Qingdao Tgood Electric Co., Ltd. (300001.SZ) Évaluation DCF |
Entièrement Modifiable: Adapté À Vos Besoins Dans Excel Ou Sheets
Conception Professionnelle: Modèles Fiables Et Conformes Aux Normes Du Secteur
Pré-Construits Pour Une Utilisation Rapide Et Efficace
Compatible MAC/PC, entièrement débloqué
Aucune Expertise N'Est Requise; Facile À Suivre
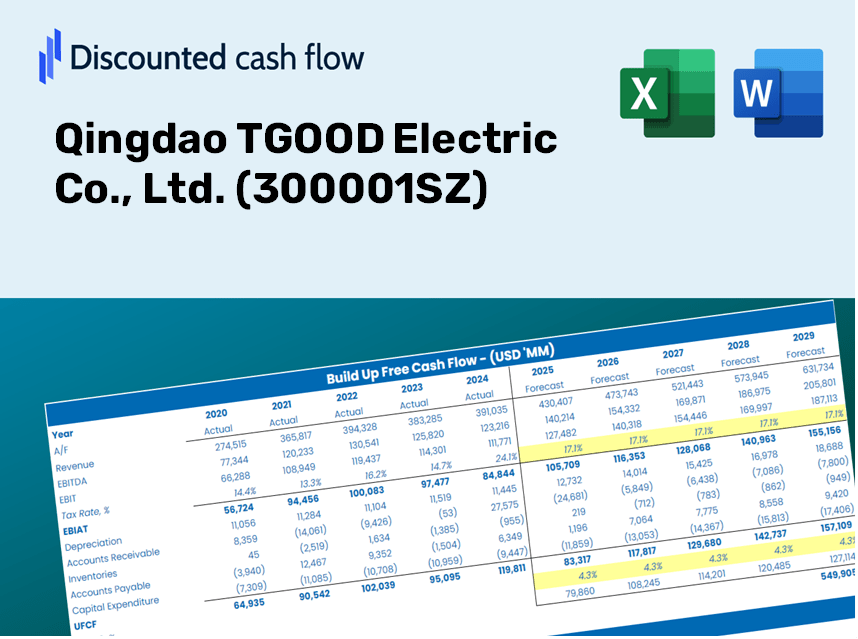
Qingdao TGOOD Electric Co., Ltd. (300001.SZ) Bundle
Améliorez vos stratégies d'investissement avec la calculatrice DCF (300001SZ)! Explorez les données financières authentiques de Qingdao Tgood Electric Co., Ltd., ajustez les projections et dépenses de croissance, et visualisez instantanément comment ces changements affectent la valeur intrinsèque de (300001SZ).
Discounted Cash Flow (DCF) - (USD MM)
| Year | AY1 2020 |
AY2 2021 |
AY3 2022 |
AY4 2023 |
AY5 2024 |
FY1 2025 |
FY2 2026 |
FY3 2027 |
FY4 2028 |
FY5 2029 |
|---|---|---|---|---|---|---|---|---|---|---|
| Revenue | 7,464.2 | 9,441.1 | 11,629.6 | 14,601.8 | 15,374.5 | 18,469.1 | 22,186.7 | 26,652.6 | 32,017.4 | 38,462.1 |
| Revenue Growth, % | 0 | 26.48 | 23.18 | 25.56 | 5.29 | 20.13 | 20.13 | 20.13 | 20.13 | 20.13 |
| EBITDA | 776.1 | 858.6 | 1,094.7 | 1,357.1 | 1,839.2 | 1,852.9 | 2,225.8 | 2,673.9 | 3,212.1 | 3,858.6 |
| EBITDA, % | 10.4 | 9.09 | 9.41 | 9.29 | 11.96 | 10.03 | 10.03 | 10.03 | 10.03 | 10.03 |
| Depreciation | 476.0 | 514.0 | 644.9 | 646.4 | 682.5 | 969.0 | 1,164.1 | 1,398.4 | 1,679.9 | 2,018.0 |
| Depreciation, % | 6.38 | 5.44 | 5.55 | 4.43 | 4.44 | 5.25 | 5.25 | 5.25 | 5.25 | 5.25 |
| EBIT | 300.0 | 344.6 | 449.8 | 710.7 | 1,156.7 | 883.9 | 1,061.8 | 1,275.5 | 1,532.2 | 1,840.6 |
| EBIT, % | 4.02 | 3.65 | 3.87 | 4.87 | 7.52 | 4.79 | 4.79 | 4.79 | 4.79 | 4.79 |
| Total Cash | 2,285.2 | 3,103.0 | 3,075.3 | 2,857.3 | 2,742.2 | 4,703.4 | 5,650.1 | 6,787.4 | 8,153.6 | 9,794.8 |
| Total Cash, percent | .0 | .0 | .0 | .0 | .0 | .0 | .0 | .0 | .0 | .0 |
| Account Receivables | 5,839.7 | 6,931.3 | 8,441.7 | 9,699.3 | 11,680.7 | 13,543.1 | 16,269.1 | 19,543.9 | 23,477.8 | 28,203.5 |
| Account Receivables, % | 78.24 | 73.42 | 72.59 | 66.43 | 75.97 | 73.33 | 73.33 | 73.33 | 73.33 | 73.33 |
| Inventories | 1,290.6 | 1,257.5 | 1,403.7 | 1,609.0 | 1,205.6 | 2,273.3 | 2,730.8 | 3,280.5 | 3,940.8 | 4,734.1 |
| Inventories, % | 17.29 | 13.32 | 12.07 | 11.02 | 7.84 | 12.31 | 12.31 | 12.31 | 12.31 | 12.31 |
| Accounts Payable | 4,730.7 | 5,686.3 | 6,607.9 | 7,734.7 | 8,078.9 | 10,562.4 | 12,688.4 | 15,242.4 | 18,310.5 | 21,996.2 |
| Accounts Payable, % | 63.38 | 60.23 | 56.82 | 52.97 | 52.55 | 57.19 | 57.19 | 57.19 | 57.19 | 57.19 |
| Capital Expenditure | -648.9 | -950.7 | -754.0 | -1,063.2 | -862.2 | -1,408.7 | -1,692.2 | -2,032.8 | -2,442.0 | -2,933.5 |
| Capital Expenditure, % | -8.69 | -10.07 | -6.48 | -7.28 | -5.61 | -7.63 | -7.63 | -7.63 | -7.63 | -7.63 |
| Tax Rate, % | 10.68 | 10.68 | 10.68 | 10.68 | 10.68 | 10.68 | 10.68 | 10.68 | 10.68 | 10.68 |
| EBITAT | 368.2 | 394.0 | 464.0 | 654.2 | 1,033.1 | 850.9 | 1,022.2 | 1,228.0 | 1,475.1 | 1,772.1 |
| Depreciation | ||||||||||
| Changes in Account Receivables | ||||||||||
| Changes in Inventories | ||||||||||
| Changes in Accounts Payable | ||||||||||
| Capital Expenditure | ||||||||||
| UFCF | -2,204.3 | -145.6 | -380.1 | -98.7 | -380.3 | -35.3 | -563.5 | -676.9 | -813.1 | -976.8 |
| WACC, % | 8.1 | 8.1 | 8.1 | 8.05 | 8.03 | 8.08 | 8.08 | 8.08 | 8.08 | 8.08 |
| PV UFCF | ||||||||||
| SUM PV UFCF | -2,309.5 | |||||||||
| Long Term Growth Rate, % | 4.00 | |||||||||
| Free cash flow (T + 1) | -1,016 | |||||||||
| Terminal Value | -24,906 | |||||||||
| Present Terminal Value | -16,889 | |||||||||
| Enterprise Value | -19,199 | |||||||||
| Net Debt | 1,557 | |||||||||
| Equity Value | -20,756 | |||||||||
| Diluted Shares Outstanding, MM | 1,030 | |||||||||
| Equity Value Per Share | -20.15 |
What You Will Receive
- Authentic TGOOD Financials: Access to both historical and projected data for precise valuation.
- Customizable Inputs: Adjust metrics such as WACC, tax rates, revenue growth, and capital expenditures.
- Real-Time Calculations: Intrinsic value and NPV are calculated in real-time.
- Scenario Analysis: Explore various scenarios to assess Qingdao TGOOD Electric Co., Ltd.'s future performance.
- User-Friendly Design: Designed for professionals while being easy to use for newcomers.
Key Features
- Comprehensive Historical Data: Access to Qingdao TGOOD Electric Co., Ltd.’s past financial statements and pre-filled projections.
- Customizable Parameters: Modify WACC, tax rates, revenue growth, and EBITDA margins to suit your analysis.
- Real-Time Calculations: Instant updates on the intrinsic value of Qingdao TGOOD Electric Co., Ltd. as adjustments are made.
- Intuitive Visual Representations: Dashboards present valuation metrics and results in a clear, user-friendly format.
- Designed for Precision: A robust tool tailored for analysts, investors, and finance professionals.
How It Works
- Step 1: Download the prebuilt Excel template featuring data for Qingdao TGOOD Electric Co., Ltd. (300001SZ).
- Step 2: Review the pre-filled sheets to familiarize yourself with essential metrics.
- Step 3: Modify forecasts and assumptions in the editable yellow cells (WACC, growth rates, margins).
- Step 4: Instantly see the recalculated results, including the intrinsic value of Qingdao TGOOD Electric Co., Ltd. (300001SZ).
- Step 5: Use the insights to make informed investment choices or create reports based on the output.
Why Opt for This Calculator for Qingdao TGOOD Electric Co., Ltd. (300001SZ)?
- Reliable Data: Utilize authentic financials from Qingdao TGOOD for trustworthy valuation results.
- Personalizable: Tailor essential metrics such as growth rates, WACC, and tax rates to align with your forecasts.
- Efficient: Pre-configured calculations save you the hassle of starting from the ground up.
- Expert-Level Tool: Crafted for investors, analysts, and consultants in the industry.
- User-Friendly: A straightforward interface and detailed instructions ensure ease of use for everyone.
Who Can Benefit from Our Product?
- Investors: Accurately assess the fair value of Qingdao TGOOD Electric Co., Ltd. (300001SZ) before making investment choices.
- CFOs: Utilize a sophisticated DCF model for comprehensive financial reporting and analysis.
- Consultants: Effortlessly customize the template for client valuation reports.
- Entrepreneurs: Acquire knowledge of financial modeling techniques employed by leading companies.
- Educators: Employ it as a resource to illustrate valuation methods in the classroom.
What the Template Includes
- Pre-Filled DCF Model: Financial data for Qingdao TGOOD Electric Co., Ltd. (300001SZ) preloaded for immediate analysis.
- WACC Calculator: Comprehensive calculations for the Weighted Average Cost of Capital specific to Qingdao TGOOD Electric Co., Ltd. (300001SZ).
- Financial Ratios: Assess Qingdao TGOOD Electric Co., Ltd. (300001SZ)'s profitability, leverage, and operational efficiency.
- Editable Inputs: Customize assumptions such as growth rates, profit margins, and CAPEX to suit your analysis needs.
- Financial Statements: Access annual and quarterly reports for in-depth financial evaluation.
- Interactive Dashboard: Effortlessly visualize key valuation metrics and outcomes.
Disclaimer
All information, articles, and product details provided on this website are for general informational and educational purposes only. We do not claim any ownership over, nor do we intend to infringe upon, any trademarks, copyrights, logos, brand names, or other intellectual property mentioned or depicted on this site. Such intellectual property remains the property of its respective owners, and any references here are made solely for identification or informational purposes, without implying any affiliation, endorsement, or partnership.
We make no representations or warranties, express or implied, regarding the accuracy, completeness, or suitability of any content or products presented. Nothing on this website should be construed as legal, tax, investment, financial, medical, or other professional advice. In addition, no part of this site—including articles or product references—constitutes a solicitation, recommendation, endorsement, advertisement, or offer to buy or sell any securities, franchises, or other financial instruments, particularly in jurisdictions where such activity would be unlawful.
All content is of a general nature and may not address the specific circumstances of any individual or entity. It is not a substitute for professional advice or services. Any actions you take based on the information provided here are strictly at your own risk. You accept full responsibility for any decisions or outcomes arising from your use of this website and agree to release us from any liability in connection with your use of, or reliance upon, the content or products found herein.