
|
Chengdu Guibao Science & Technology Co., Ltd. (300019.sz) Évaluation DCF |
Entièrement Modifiable: Adapté À Vos Besoins Dans Excel Ou Sheets
Conception Professionnelle: Modèles Fiables Et Conformes Aux Normes Du Secteur
Pré-Construits Pour Une Utilisation Rapide Et Efficace
Compatible MAC/PC, entièrement débloqué
Aucune Expertise N'Est Requise; Facile À Suivre
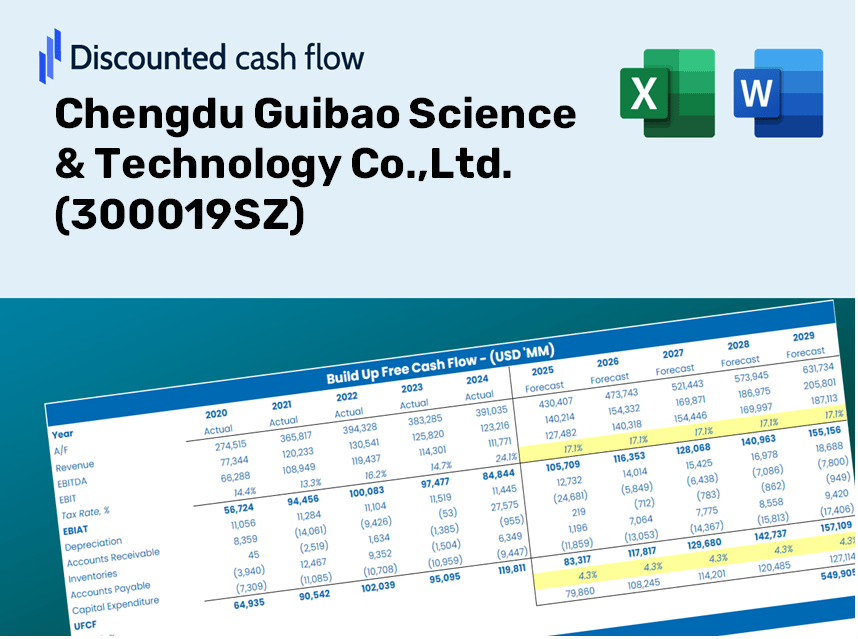
Chengdu Guibao Science & Technology Co.,Ltd. (300019.SZ) Bundle
Rationalisez votre analyse et améliorez la précision avec notre calculatrice DCF (300019SZ)! Utilisation de données réelles de Chengdu Guibao Science & Technology Co., Ltd. et hypothèses personnalisables, cet outil vous permet de prévoir, évaluer et valoriser Chengdu Guibao comme un investisseur qualifié.
Discounted Cash Flow (DCF) - (USD MM)
| Year | AY1 2020 |
AY2 2021 |
AY3 2022 |
AY4 2023 |
AY5 2024 |
FY1 2025 |
FY2 2026 |
FY3 2027 |
FY4 2028 |
FY5 2029 |
|---|---|---|---|---|---|---|---|---|---|---|
| Revenue | 1,523.6 | 2,555.7 | 2,694.5 | 2,605.6 | 3,159.0 | 3,878.5 | 4,761.9 | 5,846.4 | 7,178.1 | 8,813.0 |
| Revenue Growth, % | 0 | 67.74 | 5.43 | -3.3 | 21.24 | 22.78 | 22.78 | 22.78 | 22.78 | 22.78 |
| EBITDA | 258.6 | 320.7 | 303.8 | 395.5 | 338.1 | 517.2 | 635.0 | 779.7 | 957.2 | 1,175.3 |
| EBITDA, % | 16.97 | 12.55 | 11.28 | 15.18 | 10.7 | 13.34 | 13.34 | 13.34 | 13.34 | 13.34 |
| Depreciation | 42.9 | 49.6 | 55.7 | 60.3 | 80.4 | 90.6 | 111.3 | 136.6 | 167.7 | 205.9 |
| Depreciation, % | 2.82 | 1.94 | 2.07 | 2.31 | 2.54 | 2.34 | 2.34 | 2.34 | 2.34 | 2.34 |
| EBIT | 215.7 | 271.1 | 248.1 | 335.2 | 257.7 | 426.6 | 523.7 | 643.0 | 789.5 | 969.3 |
| EBIT, % | 14.16 | 10.61 | 9.21 | 12.86 | 8.16 | 11 | 11 | 11 | 11 | 11 |
| Total Cash | 298.7 | 934.0 | 952.7 | 998.6 | 932.2 | 1,236.0 | 1,517.5 | 1,863.2 | 2,287.5 | 2,808.5 |
| Total Cash, percent | .0 | .0 | .0 | .0 | .0 | .0 | .0 | .0 | .0 | .0 |
| Account Receivables | 489.4 | 824.1 | 716.3 | 731.9 | 1,064.9 | 1,184.9 | 1,454.7 | 1,786.1 | 2,192.9 | 2,692.3 |
| Account Receivables, % | 32.12 | 32.25 | 26.58 | 28.09 | 33.71 | 30.55 | 30.55 | 30.55 | 30.55 | 30.55 |
| Inventories | 247.9 | 369.8 | 275.9 | 314.9 | 482.2 | 530.0 | 650.7 | 798.9 | 980.9 | 1,204.3 |
| Inventories, % | 16.27 | 14.47 | 10.24 | 12.09 | 15.26 | 13.67 | 13.67 | 13.67 | 13.67 | 13.67 |
| Accounts Payable | 135.3 | 605.4 | 97.1 | 336.2 | 834.5 | 585.6 | 719.0 | 882.7 | 1,083.8 | 1,330.6 |
| Accounts Payable, % | 8.88 | 23.69 | 3.61 | 12.9 | 26.42 | 15.1 | 15.1 | 15.1 | 15.1 | 15.1 |
| Capital Expenditure | -71.4 | -87.8 | -107.4 | -189.2 | -169.0 | -191.7 | -235.4 | -289.0 | -354.9 | -435.7 |
| Capital Expenditure, % | -4.69 | -3.44 | -3.98 | -7.26 | -5.35 | -4.94 | -4.94 | -4.94 | -4.94 | -4.94 |
| Tax Rate, % | 14.87 | 14.87 | 14.87 | 14.87 | 14.87 | 14.87 | 14.87 | 14.87 | 14.87 | 14.87 |
| EBITAT | 188.9 | 242.4 | 224.8 | 297.2 | 219.4 | 376.6 | 462.3 | 567.6 | 696.9 | 855.7 |
| Depreciation | ||||||||||
| Changes in Account Receivables | ||||||||||
| Changes in Inventories | ||||||||||
| Changes in Accounts Payable | ||||||||||
| Capital Expenditure | ||||||||||
| UFCF | -441.7 | 217.8 | -133.5 | 352.8 | 128.8 | -141.2 | 81.0 | 99.4 | 122.1 | 149.9 |
| WACC, % | 6.49 | 6.49 | 6.5 | 6.49 | 6.49 | 6.49 | 6.49 | 6.49 | 6.49 | 6.49 |
| PV UFCF | ||||||||||
| SUM PV UFCF | 225.5 | |||||||||
| Long Term Growth Rate, % | 3.00 | |||||||||
| Free cash flow (T + 1) | 154 | |||||||||
| Terminal Value | 4,420 | |||||||||
| Present Terminal Value | 3,227 | |||||||||
| Enterprise Value | 3,453 | |||||||||
| Net Debt | -681 | |||||||||
| Equity Value | 4,133 | |||||||||
| Diluted Shares Outstanding, MM | 392 | |||||||||
| Equity Value Per Share | 10.56 |
What You Will Receive
- Authentic 300019SZ Financial Data: Pre-filled with Chengdu Guibao Science & Technology’s historical and projected figures for accurate analysis.
- Customizable Template: Easily adjust crucial inputs such as revenue growth, WACC, and EBITDA percentage.
- Instant Calculations: Watch the intrinsic value of Chengdu Guibao update in real-time as you make adjustments.
- Professional Valuation Tool: Tailored for investors, analysts, and consultants aiming for precise DCF outcomes.
- Intuitive Design: A straightforward layout with clear instructions suitable for users of all skill levels.
Key Features
- Accurate Financial Data: Gain access to reliable historical data and future forecasts for Chengdu Guibao Science & Technology Co., Ltd. (300019SZ).
- Tailored Forecast Assumptions: Modify highlighted fields like WACC, growth percentages, and profit margins to suit your analysis.
- Real-Time Calculations: Instant updates for DCF, Net Present Value (NPV), and cash flow assessments as inputs change.
- Interactive Dashboard: User-friendly charts and summaries that present your valuation findings clearly.
- Designed for All Users: A straightforward and intuitive layout catering to investors, CFOs, and consultants, whether novice or expert.
How It Functions
- Download: Obtain the pre-formatted Excel file containing Chengdu Guibao Science & Technology Co., Ltd.'s (300019SZ) financial data.
- Customize: Modify projections, such as revenue growth, EBITDA margin, and WACC.
- Automatic Updates: The calculations for intrinsic value and NPV refresh in real-time.
- Scenario Testing: Generate various projections and swiftly compare their results.
- Informed Decisions: Leverage the valuation outcomes to inform your investment strategy.
Why Opt for This Calculator for Chengdu Guibao Science & Technology Co., Ltd. (300019SZ)?
- Precise Financial Data: Utilize authentic Chengdu Guibao financials for dependable valuation outcomes.
- Flexible Settings: Modify essential variables such as growth rates, WACC, and tax rates to align with your forecasts.
- Efficiency Boost: Built-in calculations save you the hassle of starting from scratch.
- Professional Quality: Tailored for investors, analysts, and consultants in the field.
- Easy to Use: User-friendly design and clear, step-by-step guidance cater to all experience levels.
Who Can Benefit from This Product?
- Investors: Evaluate Chengdu Guibao Science & Technology Co., Ltd.'s (300019SZ) valuation to inform buying or selling decisions.
- CFOs and Financial Analysts: Optimize valuation methods and assess financial forecasts.
- Startup Founders: Gain insights into the valuation processes of established companies like Chengdu Guibao (300019SZ).
- Consultants: Provide clients with comprehensive valuation analysis and reports.
- Students and Educators: Utilize authentic data to learn and teach valuation practices effectively.
Components of the Template
- Pre-Filled Data: Contains Chengdu Guibao Science & Technology Co., Ltd.'s historical financials and projections.
- Discounted Cash Flow Model: An editable DCF valuation model with automated calculations.
- Weighted Average Cost of Capital (WACC): A specific sheet for computing WACC using personalized inputs.
- Key Financial Ratios: Evaluate Chengdu Guibao's profitability, efficiency, and leverage metrics.
- Customizable Inputs: Effortlessly modify revenue growth, profit margins, and tax rates.
- Clear Dashboard: Visual representations and tables that summarize essential valuation outcomes.
Disclaimer
All information, articles, and product details provided on this website are for general informational and educational purposes only. We do not claim any ownership over, nor do we intend to infringe upon, any trademarks, copyrights, logos, brand names, or other intellectual property mentioned or depicted on this site. Such intellectual property remains the property of its respective owners, and any references here are made solely for identification or informational purposes, without implying any affiliation, endorsement, or partnership.
We make no representations or warranties, express or implied, regarding the accuracy, completeness, or suitability of any content or products presented. Nothing on this website should be construed as legal, tax, investment, financial, medical, or other professional advice. In addition, no part of this site—including articles or product references—constitutes a solicitation, recommendation, endorsement, advertisement, or offer to buy or sell any securities, franchises, or other financial instruments, particularly in jurisdictions where such activity would be unlawful.
All content is of a general nature and may not address the specific circumstances of any individual or entity. It is not a substitute for professional advice or services. Any actions you take based on the information provided here are strictly at your own risk. You accept full responsibility for any decisions or outcomes arising from your use of this website and agree to release us from any liability in connection with your use of, or reliance upon, the content or products found herein.