
|
Beijing Supermap Software Co., Ltd. (300036.SZ) Valation DCF |
Entièrement Modifiable: Adapté À Vos Besoins Dans Excel Ou Sheets
Conception Professionnelle: Modèles Fiables Et Conformes Aux Normes Du Secteur
Pré-Construits Pour Une Utilisation Rapide Et Efficace
Compatible MAC/PC, entièrement débloqué
Aucune Expertise N'Est Requise; Facile À Suivre
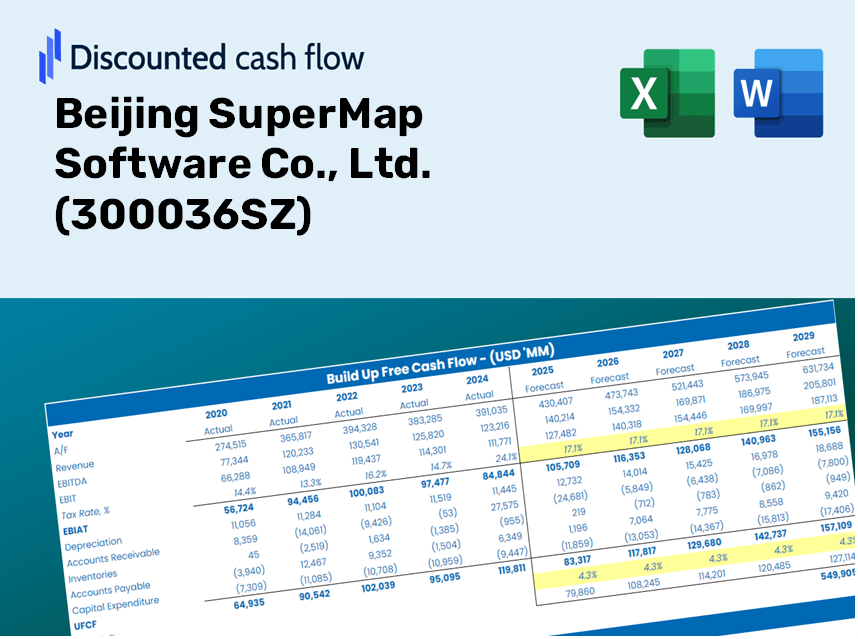
Beijing SuperMap Software Co., Ltd. (300036.SZ) Bundle
En tant qu'investisseur ou analyste, cette calculatrice DCF (300036SZ) est votre ressource incontournable pour une évaluation précise. Chargé de données réelles de Beijing Supermap Software Co., Ltd., vous pouvez ajuster les prévisions et observer instantanément les effets.
Discounted Cash Flow (DCF) - (USD MM)
| Year | AY1 2020 |
AY2 2021 |
AY3 2022 |
AY4 2023 |
AY5 2024 |
FY1 2025 |
FY2 2026 |
FY3 2027 |
FY4 2028 |
FY5 2029 |
|---|---|---|---|---|---|---|---|---|---|---|
| Revenue | 1,610.0 | 1,875.1 | 1,595.7 | 1,978.7 | 1,497.9 | 1,502.6 | 1,507.4 | 1,512.1 | 1,516.9 | 1,521.7 |
| Revenue Growth, % | 0 | 16.46 | -14.9 | 24 | -24.3 | 0.3159 | 0.3159 | 0.3159 | 0.3159 | 0.3159 |
| EBITDA | 329.5 | 386.0 | -286.6 | 237.0 | -54.1 | 94.5 | 94.8 | 95.1 | 95.4 | 95.7 |
| EBITDA, % | 20.47 | 20.59 | -17.96 | 11.98 | -3.61 | 6.29 | 6.29 | 6.29 | 6.29 | 6.29 |
| Depreciation | 65.4 | 67.9 | 82.7 | 83.6 | 113.7 | 74.2 | 74.4 | 74.7 | 74.9 | 75.1 |
| Depreciation, % | 4.06 | 3.62 | 5.18 | 4.23 | 7.59 | 4.94 | 4.94 | 4.94 | 4.94 | 4.94 |
| EBIT | 264.1 | 318.1 | -369.3 | 153.3 | -167.8 | 20.3 | 20.4 | 20.5 | 20.5 | 20.6 |
| EBIT, % | 16.4 | 16.97 | -23.15 | 7.75 | -11.2 | 1.35 | 1.35 | 1.35 | 1.35 | 1.35 |
| Total Cash | 1,150.9 | 2,012.0 | 1,728.1 | 1,820.6 | 1,353.0 | 1,363.8 | 1,368.2 | 1,372.5 | 1,376.8 | 1,381.2 |
| Total Cash, percent | .0 | .0 | .0 | .0 | .0 | .0 | .0 | .0 | .0 | .0 |
| Account Receivables | 655.1 | 781.5 | 787.3 | 818.7 | 902.6 | 701.2 | 703.5 | 705.7 | 707.9 | 710.1 |
| Account Receivables, % | 40.69 | 41.68 | 49.34 | 41.38 | 60.26 | 46.67 | 46.67 | 46.67 | 46.67 | 46.67 |
| Inventories | 326.2 | 487.3 | 496.3 | 446.5 | 385.9 | 377.7 | 378.9 | 380.1 | 381.3 | 382.5 |
| Inventories, % | 20.26 | 25.99 | 31.1 | 22.56 | 25.76 | 25.13 | 25.13 | 25.13 | 25.13 | 25.13 |
| Accounts Payable | 168.6 | 268.1 | 336.8 | 395.7 | 390.6 | 276.3 | 277.2 | 278.1 | 279.0 | 279.8 |
| Accounts Payable, % | 10.47 | 14.3 | 21.11 | 20 | 26.08 | 18.39 | 18.39 | 18.39 | 18.39 | 18.39 |
| Capital Expenditure | -74.6 | -68.4 | -66.8 | -15.9 | -11.4 | -42.2 | -42.3 | -42.4 | -42.6 | -42.7 |
| Capital Expenditure, % | -4.63 | -3.65 | -4.18 | -0.80159 | -0.76201 | -2.81 | -2.81 | -2.81 | -2.81 | -2.81 |
| Tax Rate, % | -1.5 | -1.5 | -1.5 | -1.5 | -1.5 | -1.5 | -1.5 | -1.5 | -1.5 | -1.5 |
| EBITAT | 235.7 | 288.8 | -346.1 | 151.1 | -170.3 | 19.2 | 19.3 | 19.3 | 19.4 | 19.5 |
| Depreciation | ||||||||||
| Changes in Account Receivables | ||||||||||
| Changes in Inventories | ||||||||||
| Changes in Accounts Payable | ||||||||||
| Capital Expenditure | ||||||||||
| UFCF | -586.2 | 100.3 | -276.2 | 296.1 | -96.4 | 146.6 | 48.9 | 49.0 | 49.2 | 49.3 |
| WACC, % | 9.26 | 9.26 | 9.26 | 9.26 | 9.26 | 9.26 | 9.26 | 9.26 | 9.26 | 9.26 |
| PV UFCF | ||||||||||
| SUM PV UFCF | 278.9 | |||||||||
| Long Term Growth Rate, % | 2.00 | |||||||||
| Free cash flow (T + 1) | 50 | |||||||||
| Terminal Value | 693 | |||||||||
| Present Terminal Value | 445 | |||||||||
| Enterprise Value | 724 | |||||||||
| Net Debt | -835 | |||||||||
| Equity Value | 1,559 | |||||||||
| Diluted Shares Outstanding, MM | 485 | |||||||||
| Equity Value Per Share | 3.22 |
What You Will Receive
- Adjustable Forecast Inputs: Effortlessly modify key assumptions (growth %, profit margins, discount rates) to generate diverse scenarios.
- Comprehensive Market Data: Financial information for Beijing SuperMap Software Co., Ltd. (300036SZ) pre-loaded to facilitate your analysis.
- Instant DCF Outputs: The template automatically computes the Net Present Value (NPV) and intrinsic value for your convenience.
- Tailored and Professional Design: A refined Excel model designed to meet your valuation requirements.
- Engineered for Analysts and Investors: Perfect for evaluating projections, assessing strategies, and optimizing efficiency.
Key Features
- Genuine Beijing SuperMap Financials: Obtain reliable pre-loaded historical data and future forecasts for accurate analysis.
- Flexible Forecast Assumptions: Modify highlighted cells in yellow, including WACC, growth rates, and profit margins.
- Real-Time Calculations: Automatic adjustments to DCF, Net Present Value (NPV), and cash flow evaluations.
- User-Friendly Dashboard: Intuitive charts and summaries to easily interpret your valuation outcomes.
- Designed for All Users: A straightforward and accessible layout tailored for investors, CFOs, and consultants alike.
How It Functions
- 1. Access the Template: Download and open the spreadsheet containing Beijing SuperMap Software Co., Ltd.'s preloaded data.
- 2. Modify Assumptions: Adjust essential inputs such as growth rates, WACC, and capital expenditures.
- 3. Analyze Results Immediately: The DCF model automatically computes intrinsic value and NPV.
- 4. Explore Scenarios: Evaluate various forecasts to assess different valuation possibilities.
- 5. Present with Assurance: Share expert valuation insights to back your strategic decisions.
Why Choose SuperMap Software?
- Time-Efficient: No need to develop complex mapping models from the ground up – our solutions are ready to deploy.
- Enhanced Precision: Dependable geographic data and algorithms minimize inaccuracies in mapping.
- Completely Customizable: Adjust the software to match your specific requirements and forecasts.
- User-Friendly: Intuitive visuals and outputs make data interpretation straightforward.
- Endorsed by Professionals: Crafted for experts who prioritize accuracy and ease of use.
Who Can Benefit from This Software?
- Real Estate Professionals: Utilize advanced mapping and GIS capabilities to enhance property analysis.
- Urban Planners: Streamline city planning efforts with powerful data visualization tools.
- Environmental Analysts: Quickly analyze and present geographical data for reports and presentations.
- Developers: Gain insights into site selection and feasibility studies through detailed mapping solutions.
- Students and Educators: Employ this software as a hands-on learning resource in geography and urban studies courses.
Contents of the Template
- Preloaded SuperMap Data: Historical and projected financial information, such as revenue, EBIT, and capital expenditures.
- DCF and WACC Models: Advanced spreadsheets for determining intrinsic value and Weighted Average Cost of Capital.
- Editable Inputs: Cells highlighted in yellow for modifying revenue growth rates, tax rates, and discount rates.
- Financial Statements: Detailed annual and quarterly financial reports for thorough analysis.
- Key Ratios: Metrics on profitability, leverage, and efficiency to assess company performance.
- Dashboard and Charts: Visual representations of valuation results and underlying assumptions.
Disclaimer
All information, articles, and product details provided on this website are for general informational and educational purposes only. We do not claim any ownership over, nor do we intend to infringe upon, any trademarks, copyrights, logos, brand names, or other intellectual property mentioned or depicted on this site. Such intellectual property remains the property of its respective owners, and any references here are made solely for identification or informational purposes, without implying any affiliation, endorsement, or partnership.
We make no representations or warranties, express or implied, regarding the accuracy, completeness, or suitability of any content or products presented. Nothing on this website should be construed as legal, tax, investment, financial, medical, or other professional advice. In addition, no part of this site—including articles or product references—constitutes a solicitation, recommendation, endorsement, advertisement, or offer to buy or sell any securities, franchises, or other financial instruments, particularly in jurisdictions where such activity would be unlawful.
All content is of a general nature and may not address the specific circumstances of any individual or entity. It is not a substitute for professional advice or services. Any actions you take based on the information provided here are strictly at your own risk. You accept full responsibility for any decisions or outcomes arising from your use of this website and agree to release us from any liability in connection with your use of, or reliance upon, the content or products found herein.