
|
Hubei Dinglong CO., Ltd. (300054.SZ) Évaluation DCF |
Entièrement Modifiable: Adapté À Vos Besoins Dans Excel Ou Sheets
Conception Professionnelle: Modèles Fiables Et Conformes Aux Normes Du Secteur
Pré-Construits Pour Une Utilisation Rapide Et Efficace
Compatible MAC/PC, entièrement débloqué
Aucune Expertise N'Est Requise; Facile À Suivre
Hubei Dinglong CO.,Ltd. (300054.SZ) Bundle
Améliorez votre stratégie d'investissement avec le Hubei Dinglong CO., Ltd. (300054SZ) Calculatrice DCF! Utilisez des données financières précises, ajustez les projections et les dépenses de croissance et observez instantanément comment ces modifications affectent la valeur intrinsèque de Hubei Dinglong CO., Ltd. (300054SZ).
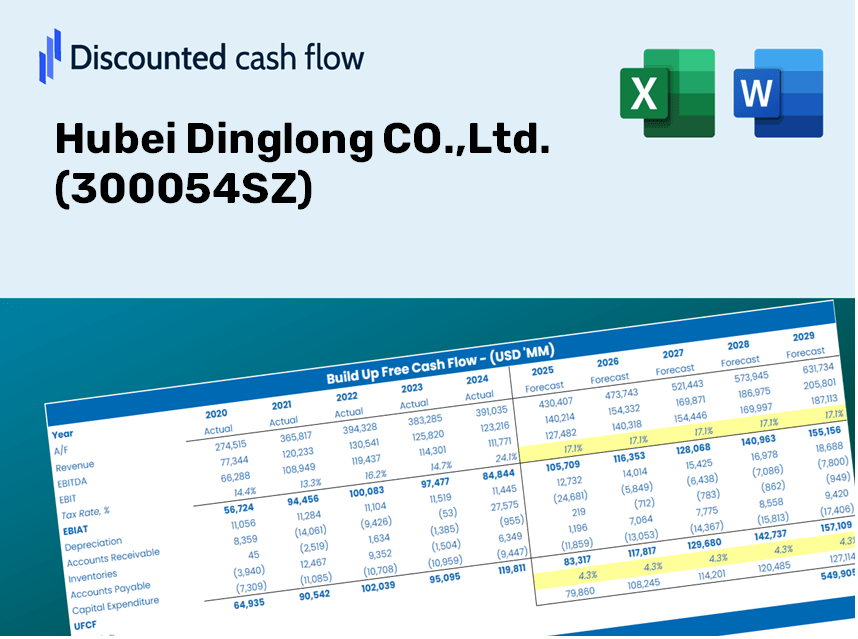
Discounted Cash Flow (DCF) - (USD MM)
| Year | AY1 2020 |
AY2 2021 |
AY3 2022 |
AY4 2023 |
AY5 2024 |
FY1 2025 |
FY2 2026 |
FY3 2027 |
FY4 2028 |
FY5 2029 |
|---|---|---|---|---|---|---|---|---|---|---|
| Revenue | 1,816.9 | 2,355.9 | 2,721.5 | 2,667.1 | 3,337.6 | 3,907.8 | 4,575.3 | 5,356.9 | 6,272.0 | 7,343.4 |
| Revenue Growth, % | 0 | 29.67 | 15.52 | -2 | 25.14 | 17.08 | 17.08 | 17.08 | 17.08 | 17.08 |
| EBITDA | 245.0 | 351.4 | 539.7 | 429.4 | 878.1 | 708.4 | 829.4 | 971.1 | 1,137.0 | 1,331.2 |
| EBITDA, % | 13.49 | 14.92 | 19.83 | 16.1 | 26.31 | 18.13 | 18.13 | 18.13 | 18.13 | 18.13 |
| Depreciation | 99.5 | 114.9 | 146.2 | 163.1 | 209.9 | 219.8 | 257.4 | 301.4 | 352.9 | 413.1 |
| Depreciation, % | 5.47 | 4.88 | 5.37 | 6.12 | 6.29 | 5.63 | 5.63 | 5.63 | 5.63 | 5.63 |
| EBIT | 145.6 | 236.5 | 393.5 | 266.3 | 668.1 | 488.6 | 572.0 | 669.7 | 784.1 | 918.1 |
| EBIT, % | 8.01 | 10.04 | 14.46 | 9.98 | 20.02 | 12.5 | 12.5 | 12.5 | 12.5 | 12.5 |
| Total Cash | 1,331.4 | 1,149.3 | 1,070.0 | 1,186.0 | 1,053.9 | 1,855.6 | 2,172.6 | 2,543.8 | 2,978.3 | 3,487.1 |
| Total Cash, percent | .0 | .0 | .0 | .0 | .0 | .0 | .0 | .0 | .0 | .0 |
| Account Receivables | 486.0 | 737.0 | 926.1 | 988.0 | 1,132.6 | 1,274.3 | 1,491.9 | 1,746.8 | 2,045.2 | 2,394.5 |
| Account Receivables, % | 26.75 | 31.28 | 34.03 | 37.05 | 33.93 | 32.61 | 32.61 | 32.61 | 32.61 | 32.61 |
| Inventories | 401.3 | 523.9 | 546.9 | 499.1 | 562.8 | 781.5 | 915.0 | 1,071.3 | 1,254.3 | 1,468.6 |
| Inventories, % | 22.09 | 22.24 | 20.1 | 18.71 | 16.86 | 20 | 20 | 20 | 20 | 20 |
| Accounts Payable | 183.1 | 254.6 | 296.2 | 340.8 | 356.0 | 431.5 | 505.2 | 591.5 | 692.6 | 810.9 |
| Accounts Payable, % | 10.08 | 10.81 | 10.88 | 12.78 | 10.67 | 11.04 | 11.04 | 11.04 | 11.04 | 11.04 |
| Capital Expenditure | -207.1 | -372.2 | -676.1 | -1,028.6 | -768.5 | -888.1 | -1,039.8 | -1,217.4 | -1,425.4 | -1,668.9 |
| Capital Expenditure, % | -11.4 | -15.8 | -24.84 | -38.56 | -23.03 | -22.73 | -22.73 | -22.73 | -22.73 | -22.73 |
| Tax Rate, % | 27.2 | 27.2 | 27.2 | 27.2 | 27.2 | 27.2 | 27.2 | 27.2 | 27.2 | 27.2 |
| EBITAT | 253.2 | 172.1 | 318.6 | 185.6 | 486.4 | 387.2 | 453.3 | 530.7 | 621.4 | 727.6 |
| Depreciation | ||||||||||
| Changes in Account Receivables | ||||||||||
| Changes in Inventories | ||||||||||
| Changes in Accounts Payable | ||||||||||
| Capital Expenditure | ||||||||||
| UFCF | -558.6 | -387.2 | -382.0 | -649.3 | -265.3 | -565.9 | -606.5 | -710.2 | -831.5 | -973.5 |
| WACC, % | 6.25 | 6.22 | 6.23 | 6.21 | 6.22 | 6.23 | 6.23 | 6.23 | 6.23 | 6.23 |
| PV UFCF | ||||||||||
| SUM PV UFCF | -3,035.6 | |||||||||
| Long Term Growth Rate, % | 4.00 | |||||||||
| Free cash flow (T + 1) | -1,012 | |||||||||
| Terminal Value | -45,495 | |||||||||
| Present Terminal Value | -33,637 | |||||||||
| Enterprise Value | -36,673 | |||||||||
| Net Debt | 45 | |||||||||
| Equity Value | -36,717 | |||||||||
| Diluted Shares Outstanding, MM | 947 | |||||||||
| Equity Value Per Share | -38.78 |
Benefits You Will Receive
- Customizable Excel Template: A fully adaptable Excel-based DCF Calculator featuring pre-filled financial data for Hubei Dinglong CO.,Ltd. (300054SZ).
- Comprehensive Data: Access to historical performance data and future projections (displayed in the highlighted cells).
- Adjustable Forecasts: Modify key assumptions such as revenue growth, EBITDA margin, and WACC.
- Real-Time Calculations: Instantly observe how your modifications impact the valuation of Hubei Dinglong CO.,Ltd. (300054SZ).
- Professional-Grade Tool: Designed for investors, CFOs, consultants, and financial analysts.
- Intuitive Interface: Organized for easy navigation and usability, complete with step-by-step guidance.
Key Features
- Comprehensive Historical Data: Hubei Dinglong's financial statements along with pre-filled projections.
- Customizable Parameters: Modify WACC, tax rates, revenue growth, and EBITDA margins as needed.
- Real-Time Insights: Observe the intrinsic value of Hubei Dinglong ([300054SZ]) update instantly.
- Intuitive Visual Display: Dashboard graphs present valuation results and essential metrics clearly.
- Precision Driven: A robust tool designed for analysts, investors, and financial professionals.
How It Operates
- Step 1: Download the ready-made Excel template featuring Hubei Dinglong CO., Ltd.'s (300054SZ) data.
- Step 2: Navigate through the pre-filled sheets to grasp the essential metrics.
- Step 3: Modify forecasts and assumptions in the editable yellow cells (WACC, growth, margins).
- Step 4: Instantly access updated results, including Hubei Dinglong CO., Ltd.'s (300054SZ) intrinsic value.
- Step 5: Make well-informed investment choices or create reports based on the outputs.
Why Choose Hubei Dinglong CO., Ltd. ([300054SZ]) Calculator?
- Reliable Data: Access authentic financial information from Hubei Dinglong for trustworthy valuation outcomes.
- Customizable Features: Tailor essential inputs like growth assumptions, discount rates, and taxation levels to fit your forecasts.
- Efficiency Boost: Utilize ready-to-use calculations to save time and avoid starting from scratch.
- Professional-Quality Tool: Crafted for investors, analysts, and consultants in the field.
- User-Friendly Interface: An intuitive design and comprehensive guidance ensure ease of use for everyone.
Who Can Benefit from This Product?
- Professional Investors: Create comprehensive and accurate valuation models for analyzing investments in Hubei Dinglong Co., Ltd. (300054SZ).
- Corporate Finance Teams: Evaluate valuation scenarios to inform strategic decisions within the organization.
- Consultants and Advisors: Offer clients precise valuation insights for Hubei Dinglong Co., Ltd. (300054SZ).
- Students and Educators: Utilize real-world data to enhance financial modeling skills and instruction.
- Industry Enthusiasts: Gain insights into how companies like Hubei Dinglong Co., Ltd. (300054SZ) are valued in the marketplace.
Contents of the Template
- Historical Data: Comprises Hubei Dinglong CO.,Ltd.'s past financial performance and foundational forecasts.
- DCF and Levered DCF Models: Comprehensive templates used to determine the intrinsic value of Hubei Dinglong CO.,Ltd. (300054SZ).
- WACC Sheet: Pre-assembled calculations for the Weighted Average Cost of Capital.
- Editable Inputs: Adjust critical parameters such as growth rates, EBITDA percentages, and CAPEX assumptions.
- Quarterly and Annual Statements: A thorough analysis of Hubei Dinglong CO.,Ltd.'s financial data.
- Interactive Dashboard: Dynamically visualize valuation outcomes and forecasts.
Disclaimer
All information, articles, and product details provided on this website are for general informational and educational purposes only. We do not claim any ownership over, nor do we intend to infringe upon, any trademarks, copyrights, logos, brand names, or other intellectual property mentioned or depicted on this site. Such intellectual property remains the property of its respective owners, and any references here are made solely for identification or informational purposes, without implying any affiliation, endorsement, or partnership.
We make no representations or warranties, express or implied, regarding the accuracy, completeness, or suitability of any content or products presented. Nothing on this website should be construed as legal, tax, investment, financial, medical, or other professional advice. In addition, no part of this site—including articles or product references—constitutes a solicitation, recommendation, endorsement, advertisement, or offer to buy or sell any securities, franchises, or other financial instruments, particularly in jurisdictions where such activity would be unlawful.
All content is of a general nature and may not address the specific circumstances of any individual or entity. It is not a substitute for professional advice or services. Any actions you take based on the information provided here are strictly at your own risk. You accept full responsibility for any decisions or outcomes arising from your use of this website and agree to release us from any liability in connection with your use of, or reliance upon, the content or products found herein.