
|
Bluefocus Intelligent Communications Group Co., Ltd. (300058.SZ) Évaluation DCF |
Entièrement Modifiable: Adapté À Vos Besoins Dans Excel Ou Sheets
Conception Professionnelle: Modèles Fiables Et Conformes Aux Normes Du Secteur
Pré-Construits Pour Une Utilisation Rapide Et Efficace
Compatible MAC/PC, entièrement débloqué
Aucune Expertise N'Est Requise; Facile À Suivre
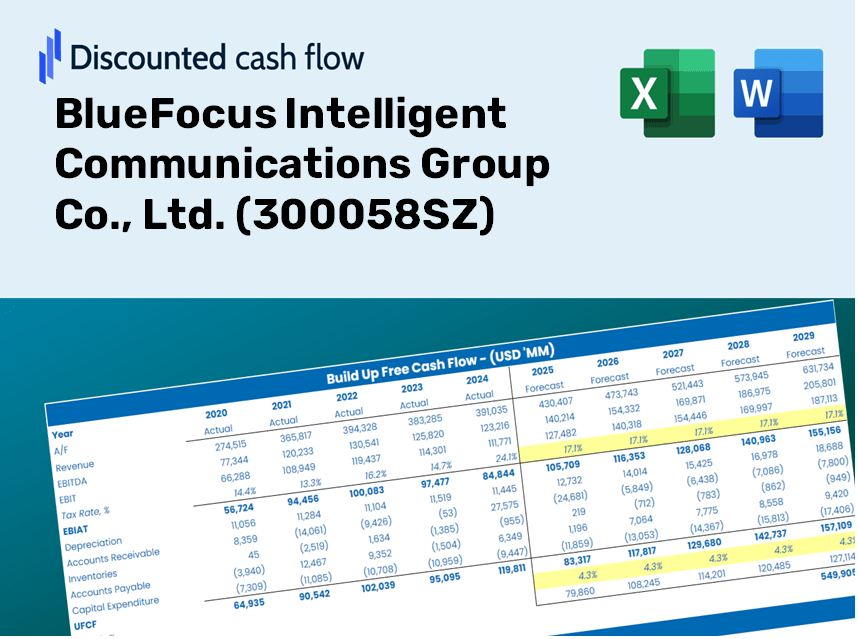
BlueFocus Intelligent Communications Group Co., Ltd. (300058.SZ) Bundle
Évaluez les perspectives financières de Bluefocus Intelligent Communications Group Co., Ltd. comme un expert! Cette calculatrice (300058SZ) DCF est livrée avec des données financières pré-remplies et offre une pleine flexibilité pour modifier la croissance des revenus, le WACC, les marges et autres hypothèses essentielles pour s'aligner sur vos prévisions.
What You Will Receive
- Authentic BlueFocus Data: Comprehensive financial metrics – spanning revenue to EBIT – derived from actual and forecasted figures.
- Complete Customization: Modify all key parameters (yellow cells) such as WACC, growth %, and tax rates to fit your analysis.
- Real-Time Valuation Updates: Automatic recalculations to assess the effects of changes on BlueFocus's fair value.
- Flexible Excel Template: Designed for quick modifications, scenario analyses, and in-depth projections.
- Efficient and Precise: Avoid the hassle of building models from scratch while ensuring accuracy and adaptability.
Highlighted Features
- Customizable Financial Inputs: Adjust essential variables such as revenue growth, EBITDA %, and capital investments.
- Instant DCF Valuation: Quickly computes intrinsic value, NPV, and additional financial metrics.
- High-Precision Analysis: Leverages real-world data from BlueFocus Intelligent Communications Group Co., Ltd. (300058SZ) for accurate valuation results.
- Effortless Scenario Testing: Easily explore various assumptions and analyze their impacts side by side.
- Efficiency Booster: Avoid the hassle of creating intricate valuation models from the ground up.
How It Works
- Step 1: Download the Excel file.
- Step 2: Review BlueFocus Intelligent Communications Group Co., Ltd.'s pre-filled financial data and forecasts.
- Step 3: Adjust key inputs such as revenue growth, WACC, and tax rates (highlighted cells).
- Step 4: Observe the DCF model update in real-time as you adjust your assumptions.
- Step 5: Evaluate the outputs and leverage the results for your investment strategies.
Why Opt for BlueFocus Intelligent Communications Group Co., Ltd. ([300058SZ])?
- All-in-One Solution: Integrates DCF, WACC, and comprehensive financial ratio analyses seamlessly.
- Flexible Input Options: Modify the yellow-highlighted fields to explore different scenarios.
- In-Depth Analysis: Automatically computes the intrinsic value and Net Present Value for BlueFocus.
- Data Ready to Use: Comes with historical and forecasted data for reliable baseline measurements.
- High-Quality Standards: Designed for financial analysts, investors, and business consultants alike.
Who Can Benefit from BlueFocus Intelligent Communications Group Co., Ltd. (300058SZ)?
- Marketing Students: Discover effective communication strategies and apply them to real-world scenarios.
- Researchers: Integrate industry-leading models into your academic projects and studies.
- Advertisers: Validate your marketing assumptions and analyze outcomes based on BlueFocus's performance.
- Market Analysts: Enhance your analysis with a customizable model tailored for the communications sector.
- Entrepreneurs: Understand how major firms like BlueFocus are evaluated and learn from their business approaches.
Contents of the Template
- In-Depth DCF Model: A modifiable template featuring extensive valuation calculations.
- Historical Data Included: BlueFocus's historical and forecasted financials are pre-loaded for your evaluation.
- Adjustable Assumptions: Modify WACC, growth rates, and tax variables to explore different scenarios.
- Detailed Financial Statements: Comprehensive annual and quarterly reports for thorough analysis.
- Key Financial Ratios: Integrated analysis of profitability, efficiency, and leverage metrics.
- Visual Dashboard: Graphs and tables presenting clear, actionable insights for decision-making.
Disclaimer
All information, articles, and product details provided on this website are for general informational and educational purposes only. We do not claim any ownership over, nor do we intend to infringe upon, any trademarks, copyrights, logos, brand names, or other intellectual property mentioned or depicted on this site. Such intellectual property remains the property of its respective owners, and any references here are made solely for identification or informational purposes, without implying any affiliation, endorsement, or partnership.
We make no representations or warranties, express or implied, regarding the accuracy, completeness, or suitability of any content or products presented. Nothing on this website should be construed as legal, tax, investment, financial, medical, or other professional advice. In addition, no part of this site—including articles or product references—constitutes a solicitation, recommendation, endorsement, advertisement, or offer to buy or sell any securities, franchises, or other financial instruments, particularly in jurisdictions where such activity would be unlawful.
All content is of a general nature and may not address the specific circumstances of any individual or entity. It is not a substitute for professional advice or services. Any actions you take based on the information provided here are strictly at your own risk. You accept full responsibility for any decisions or outcomes arising from your use of this website and agree to release us from any liability in connection with your use of, or reliance upon, the content or products found herein.