
|
Chengdu Corpro Technology Co., Ltd. (300101.SZ) Évaluation DCF |
Entièrement Modifiable: Adapté À Vos Besoins Dans Excel Ou Sheets
Conception Professionnelle: Modèles Fiables Et Conformes Aux Normes Du Secteur
Pré-Construits Pour Une Utilisation Rapide Et Efficace
Compatible MAC/PC, entièrement débloqué
Aucune Expertise N'Est Requise; Facile À Suivre
Chengdu CORPRO Technology Co., Ltd. (300101.SZ) Bundle
Conçu pour la précision, notre (300101SZ) Calculator DCF vous permet d'évaluer l'évaluation de Chengdu Corpro Technology Co., Ltd. à l'aide de données financières réelles tout en offrant une flexibilité complète pour modifier tous les paramètres essentiels pour des projections améliorées.
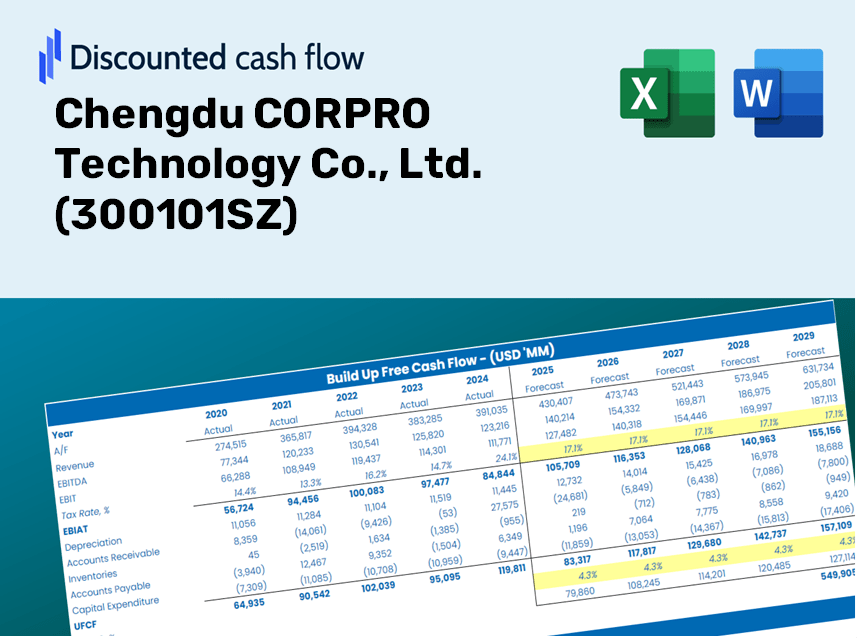
Discounted Cash Flow (DCF) - (USD MM)
| Year | AY1 2020 |
AY2 2021 |
AY3 2022 |
AY4 2023 |
AY5 2024 |
FY1 2025 |
FY2 2026 |
FY3 2027 |
FY4 2028 |
FY5 2029 |
|---|---|---|---|---|---|---|---|---|---|---|
| Revenue | 577.2 | 793.5 | 1,182.4 | 851.9 | 797.1 | 900.9 | 1,018.3 | 1,150.9 | 1,300.8 | 1,470.2 |
| Revenue Growth, % | 0 | 37.48 | 49.01 | -27.95 | -6.44 | 13.03 | 13.03 | 13.03 | 13.03 | 13.03 |
| EBITDA | 132.9 | 195.0 | 350.3 | 168.9 | 103.5 | 198.2 | 224.1 | 253.3 | 286.2 | 323.5 |
| EBITDA, % | 23.03 | 24.57 | 29.62 | 19.82 | 12.98 | 22.01 | 22.01 | 22.01 | 22.01 | 22.01 |
| Depreciation | 72.7 | 97.9 | 115.8 | 132.5 | 103.1 | 113.9 | 128.7 | 145.5 | 164.5 | 185.9 |
| Depreciation, % | 12.59 | 12.34 | 9.79 | 15.55 | 12.94 | 12.64 | 12.64 | 12.64 | 12.64 | 12.64 |
| EBIT | 60.2 | 97.0 | 234.5 | 36.4 | .3 | 84.3 | 95.3 | 107.7 | 121.8 | 137.6 |
| EBIT, % | 10.44 | 12.23 | 19.83 | 4.27 | 0.04350415 | 9.36 | 9.36 | 9.36 | 9.36 | 9.36 |
| Total Cash | 342.6 | 415.6 | 282.2 | 313.2 | 341.3 | 387.8 | 438.3 | 495.3 | 559.9 | 632.8 |
| Total Cash, percent | .0 | .0 | .0 | .0 | .0 | .0 | .0 | .0 | .0 | .0 |
| Account Receivables | 529.6 | 659.7 | 1,115.9 | 1,168.4 | 1,302.7 | 845.5 | 955.7 | 1,080.2 | 1,220.8 | 1,379.9 |
| Account Receivables, % | 91.76 | 83.13 | 94.38 | 137.15 | 163.44 | 93.85 | 93.85 | 93.85 | 93.85 | 93.85 |
| Inventories | 480.8 | 549.6 | 529.6 | 515.1 | 581.8 | 596.1 | 673.7 | 761.4 | 860.6 | 972.7 |
| Inventories, % | 83.3 | 69.26 | 44.79 | 60.47 | 72.99 | 66.16 | 66.16 | 66.16 | 66.16 | 66.16 |
| Accounts Payable | 217.3 | 244.2 | 381.2 | 315.4 | 238.9 | 302.1 | 341.4 | 385.9 | 436.2 | 493.0 |
| Accounts Payable, % | 37.64 | 30.78 | 32.24 | 37.03 | 29.97 | 33.53 | 33.53 | 33.53 | 33.53 | 33.53 |
| Capital Expenditure | -115.1 | -113.2 | -145.6 | -112.6 | -203.8 | -153.7 | -173.7 | -196.3 | -221.9 | -250.8 |
| Capital Expenditure, % | -19.94 | -14.26 | -12.32 | -13.21 | -25.57 | -17.06 | -17.06 | -17.06 | -17.06 | -17.06 |
| Tax Rate, % | -61.73 | -61.73 | -61.73 | -61.73 | -61.73 | -61.73 | -61.73 | -61.73 | -61.73 | -61.73 |
| EBITAT | 51.5 | 93.2 | 204.5 | 49.7 | .6 | 79.1 | 89.4 | 101.0 | 114.2 | 129.0 |
| Depreciation | ||||||||||
| Changes in Account Receivables | ||||||||||
| Changes in Inventories | ||||||||||
| Changes in Accounts Payable | ||||||||||
| Capital Expenditure | ||||||||||
| UFCF | -784.1 | -93.9 | -124.6 | -34.2 | -377.5 | 545.4 | -104.0 | -117.6 | -132.9 | -150.2 |
| WACC, % | 10.08 | 10.09 | 10.08 | 10.1 | 10.1 | 10.09 | 10.09 | 10.09 | 10.09 | 10.09 |
| PV UFCF | ||||||||||
| SUM PV UFCF | 138.1 | |||||||||
| Long Term Growth Rate, % | 4.00 | |||||||||
| Free cash flow (T + 1) | -156 | |||||||||
| Terminal Value | -2,565 | |||||||||
| Present Terminal Value | -1,586 | |||||||||
| Enterprise Value | -1,448 | |||||||||
| Net Debt | 30 | |||||||||
| Equity Value | -1,478 | |||||||||
| Diluted Shares Outstanding, MM | 566 | |||||||||
| Equity Value Per Share | -2.61 |
Benefits You Will Receive
- Authentic CORPRO Financial Data: Pre-filled with Chengdu CORPRO Technology's historical and projected metrics for accurate analysis.
- Fully Customizable Template: Easily adjust key inputs such as revenue growth, WACC, and EBITDA %.
- Instant Calculations: Witness the intrinsic value of CORPRO update automatically as you make adjustments.
- Professional Valuation Tool: Tailored for investors, analysts, and consultants aiming for precise DCF outcomes.
- Intuitive Design: Streamlined layout and straightforward instructions suitable for all skill levels.
Core Benefits
- Customizable Forecast Inputs: Adjust essential parameters such as revenue growth, EBITDA margin, and capital expenditure.
- Instant DCF Valuation: Automatically computes intrinsic value, NPV, and additional financial metrics in real-time.
- High-Precision Accuracy: Leverages Chengdu CORPRO Technology's actual financial data for credible valuation results.
- Simplified Scenario Analysis: Effortlessly explore various assumptions and evaluate their impacts side by side.
- Efficiency Boost: Remove the hassle of creating intricate valuation models from the ground up.
How It Operates
- Step 1: Download the Excel spreadsheet.
- Step 2: Examine the pre-filled financial information and projections for Chengdu CORPRO Technology Co., Ltd. (300101SZ).
- Step 3: Adjust key variables such as revenue growth, WACC, and tax rates (highlighted fields).
- Step 4: Observe the DCF model refresh in real-time as you modify the assumptions.
- Step 5: Evaluate the results and utilize the findings for investment strategies.
Why Select Our Calculator?
- Precision: Accurate financial data from Chengdu CORPRO Technology Co., Ltd. ensures reliability.
- Versatility: Engineered for users to effortlessly test and adjust inputs.
- Efficiency: Eliminate the complexity of creating a DCF model from the ground up.
- High-Quality Standards: Crafted with the precision and functionality expected at the CFO level.
- User-Centric: Designed to be straightforward, even for those without extensive financial modeling expertise.
Who Can Benefit from This Product?
- Investors: Assess the fair value of Chengdu CORPRO Technology Co., Ltd. (300101SZ) effectively before making investment choices.
- CFOs: Utilize a high-quality DCF model for comprehensive financial reporting and analysis.
- Consultants: Efficiently customize the template for client valuation reports.
- Entrepreneurs: Acquire insights into the financial modeling techniques employed by leading corporations.
- Educators: Employ it as a resource to illustrate various valuation methodologies in the classroom.
Contents of the Template
- Historical Data: Comprehensive records of Chengdu CORPRO Technology Co., Ltd.'s (300101SZ) past financial performance and foundational forecasts.
- DCF and Levered DCF Models: In-depth templates designed to calculate the intrinsic value of Chengdu CORPRO Technology Co., Ltd. (300101SZ).
- WACC Sheet: Pre-configured calculations for the Weighted Average Cost of Capital.
- Editable Inputs: Customize essential drivers such as growth rates, EBITDA %, and CAPEX assumptions.
- Quarterly and Annual Statements: A comprehensive analysis of the financial statements for Chengdu CORPRO Technology Co., Ltd. (300101SZ).
- Interactive Dashboard: A dynamic interface to visualize valuation results and future projections.
Disclaimer
All information, articles, and product details provided on this website are for general informational and educational purposes only. We do not claim any ownership over, nor do we intend to infringe upon, any trademarks, copyrights, logos, brand names, or other intellectual property mentioned or depicted on this site. Such intellectual property remains the property of its respective owners, and any references here are made solely for identification or informational purposes, without implying any affiliation, endorsement, or partnership.
We make no representations or warranties, express or implied, regarding the accuracy, completeness, or suitability of any content or products presented. Nothing on this website should be construed as legal, tax, investment, financial, medical, or other professional advice. In addition, no part of this site—including articles or product references—constitutes a solicitation, recommendation, endorsement, advertisement, or offer to buy or sell any securities, franchises, or other financial instruments, particularly in jurisdictions where such activity would be unlawful.
All content is of a general nature and may not address the specific circumstances of any individual or entity. It is not a substitute for professional advice or services. Any actions you take based on the information provided here are strictly at your own risk. You accept full responsibility for any decisions or outcomes arising from your use of this website and agree to release us from any liability in connection with your use of, or reliance upon, the content or products found herein.