
|
Shenzhen Everwin Precision Technology Co., Ltd. (300115.SZ) Valation DCF |
Entièrement Modifiable: Adapté À Vos Besoins Dans Excel Ou Sheets
Conception Professionnelle: Modèles Fiables Et Conformes Aux Normes Du Secteur
Pré-Construits Pour Une Utilisation Rapide Et Efficace
Compatible MAC/PC, entièrement débloqué
Aucune Expertise N'Est Requise; Facile À Suivre
Shenzhen Everwin Precision Technology Co., Ltd. (300115.SZ) Bundle
Simplifiez Shenzhen Everwin Precision Technology Co., Ltd. Valation avec cette calculatrice DCF personnalisable! Doté de Real Shenzhen Everwin Precision Technology Co., Ltd. Financials and Rajustement des intrants de prévision, vous pouvez tester des scénarios et découvrir Shenzhen Everwin Precision Technology Co., Ltd. Fair Value en minutes.
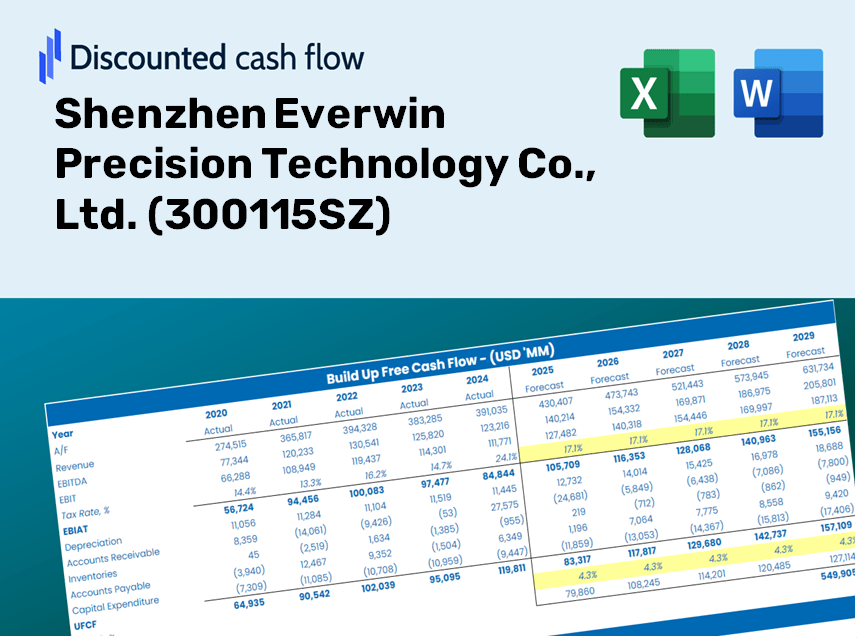
Discounted Cash Flow (DCF) - (USD MM)
| Year | AY1 2020 |
AY2 2021 |
AY3 2022 |
AY4 2023 |
AY5 2024 |
FY1 2025 |
FY2 2026 |
FY3 2027 |
FY4 2028 |
FY5 2029 |
|---|---|---|---|---|---|---|---|---|---|---|
| Revenue | 9,797.9 | 11,046.5 | 15,202.9 | 13,722.5 | 16,934.2 | 19,645.2 | 22,790.2 | 26,438.7 | 30,671.3 | 35,581.6 |
| Revenue Growth, % | 0 | 12.74 | 37.63 | -9.74 | 23.4 | 16.01 | 16.01 | 16.01 | 16.01 | 16.01 |
| EBITDA | 1,596.9 | 218.4 | 1,034.6 | 1,586.6 | 1,710.2 | 1,836.5 | 2,130.5 | 2,471.6 | 2,867.3 | 3,326.3 |
| EBITDA, % | 16.3 | 1.98 | 6.81 | 11.56 | 10.1 | 9.35 | 9.35 | 9.35 | 9.35 | 9.35 |
| Depreciation | 765.8 | 838.1 | 975.4 | 1,265.1 | 913.6 | 1,431.5 | 1,660.6 | 1,926.5 | 2,234.9 | 2,592.7 |
| Depreciation, % | 7.82 | 7.59 | 6.42 | 9.22 | 5.4 | 7.29 | 7.29 | 7.29 | 7.29 | 7.29 |
| EBIT | 831.0 | -619.7 | 59.2 | 321.6 | 796.6 | 405.1 | 469.9 | 545.1 | 632.4 | 733.6 |
| EBIT, % | 8.48 | -5.61 | 0.38944 | 2.34 | 4.7 | 2.06 | 2.06 | 2.06 | 2.06 | 2.06 |
| Total Cash | 2,732.1 | 1,596.8 | 1,755.1 | 2,299.5 | 2,410.4 | 3,334.8 | 3,868.6 | 4,488.0 | 5,206.5 | 6,040.0 |
| Total Cash, percent | .0 | .0 | .0 | .0 | .0 | .0 | .0 | .0 | .0 | .0 |
| Account Receivables | 2,633.6 | 3,023.1 | 3,616.4 | 3,347.2 | 3,715.4 | 4,886.4 | 5,668.6 | 6,576.1 | 7,628.9 | 8,850.2 |
| Account Receivables, % | 26.88 | 27.37 | 23.79 | 24.39 | 21.94 | 24.87 | 24.87 | 24.87 | 24.87 | 24.87 |
| Inventories | 3,033.7 | 4,255.2 | 3,563.4 | 3,511.8 | 3,698.7 | 5,514.6 | 6,397.5 | 7,421.7 | 8,609.8 | 9,988.2 |
| Inventories, % | 30.96 | 38.52 | 23.44 | 25.59 | 21.84 | 28.07 | 28.07 | 28.07 | 28.07 | 28.07 |
| Accounts Payable | 2,931.9 | 3,820.9 | 3,128.4 | 3,552.7 | 4,796.9 | 5,473.4 | 6,349.7 | 7,366.2 | 8,545.5 | 9,913.6 |
| Accounts Payable, % | 29.92 | 34.59 | 20.58 | 25.89 | 28.33 | 27.86 | 27.86 | 27.86 | 27.86 | 27.86 |
| Capital Expenditure | -1,497.0 | -1,882.9 | -1,824.6 | -1,402.1 | -1,848.1 | -2,571.8 | -2,983.5 | -3,461.2 | -4,015.3 | -4,658.1 |
| Capital Expenditure, % | -15.28 | -17.04 | -12 | -10.22 | -10.91 | -13.09 | -13.09 | -13.09 | -13.09 | -13.09 |
| Tax Rate, % | 18.63 | 18.63 | 18.63 | 18.63 | 18.63 | 18.63 | 18.63 | 18.63 | 18.63 | 18.63 |
| EBITAT | 739.3 | -518.9 | 130.4 | 181.4 | 648.2 | 332.5 | 385.8 | 447.5 | 519.2 | 602.3 |
| Depreciation | ||||||||||
| Changes in Account Receivables | ||||||||||
| Changes in Inventories | ||||||||||
| Changes in Accounts Payable | ||||||||||
| Capital Expenditure | ||||||||||
| UFCF | -2,727.3 | -2,285.6 | -1,312.9 | 789.4 | 402.7 | -3,118.1 | -1,726.0 | -2,002.3 | -2,322.8 | -2,694.7 |
| WACC, % | 8.91 | 8.89 | 8.96 | 8.77 | 8.88 | 8.88 | 8.88 | 8.88 | 8.88 | 8.88 |
| PV UFCF | ||||||||||
| SUM PV UFCF | -9,284.6 | |||||||||
| Long Term Growth Rate, % | 3.50 | |||||||||
| Free cash flow (T + 1) | -2,789 | |||||||||
| Terminal Value | -51,834 | |||||||||
| Present Terminal Value | -33,873 | |||||||||
| Enterprise Value | -43,158 | |||||||||
| Net Debt | 2,556 | |||||||||
| Equity Value | -45,714 | |||||||||
| Diluted Shares Outstanding, MM | 1,286 | |||||||||
| Equity Value Per Share | -35.55 |
Benefits You'll Receive
- Pre-Filled Financial Model: Incorporates Shenzhen Everwin Precision Technology Co., Ltd.'s (300115SZ) actual data for accurate DCF valuation.
- Comprehensive Forecast Control: Modify revenue growth, profit margins, WACC, and other essential parameters.
- Real-Time Calculations: Automatic updates allow you to view outcomes immediately as you make adjustments.
- Professional-Grade Template: An expertly designed Excel file suitable for serious investment analysis.
- Flexible and Reusable: Customizable features that support repeated use for in-depth forecasting.
Key Features
- Pre-Loaded Data: Historical financial reports and pre-calculated forecasts for Shenzhen Everwin Precision Technology Co., Ltd. (300115SZ).
- Fully Customizable Inputs: Modify WACC, tax rates, revenue growth, and EBITDA margins to suit your analysis.
- Real-Time Results: Instantly view the recalculated intrinsic value of Shenzhen Everwin Precision Technology Co., Ltd. (300115SZ).
- Clear Visual Outputs: Interactive dashboard charts illustrate valuation outcomes and essential metrics.
- Designed for Precision: A reliable tool tailored for analysts, investors, and finance professionals.
How It Works
- Step 1: Download the Excel file for Shenzhen Everwin Precision Technology Co., Ltd. (300115SZ).
- Step 2: Examine the pre-filled financial data and projections for Everwin.
- Step 3: Adjust key inputs such as revenue growth, WACC, and tax rates (cells indicated for modification).
- Step 4: Observe the DCF model refresh in real time as you adjust your assumptions.
- Step 5: Evaluate the results and apply them to your investment strategies.
Why Choose This Calculator for Shenzhen Everwin Precision Technology Co., Ltd. (300115SZ)?
- Reliable Data: Utilize authentic financials from Everwin to achieve accurate valuation outcomes.
- Flexible Options: Modify essential metrics such as growth rates, WACC, and tax rates to align with your forecasts.
- Efficiency Boost: Built-in calculations save you the hassle of starting from the beginning.
- High-Quality Tool: Crafted for investors, analysts, and consultants in the field.
- Easy to Use: A straightforward design with clear instructions makes it accessible for everyone.
Who Should Utilize This Product?
- Investors: Determine the fair value of Shenzhen Everwin Precision Technology Co., Ltd. (300115SZ) prior to making investment choices.
- CFOs: Utilize a professional-grade DCF model for comprehensive financial reporting and analysis.
- Consultants: Effortlessly customize the template for client valuation reports.
- Entrepreneurs: Acquire knowledge of financial modeling practices used by leading companies.
- Educators: Employ this tool to illustrate various valuation methodologies in the classroom.
Contents of the Template
- Pre-Filled Data: Features Shenzhen Everwin Precision Technology Co., Ltd.’s historical financials and projections.
- Discounted Cash Flow Model: Editable DCF valuation model with automatic calculation functionalities.
- Weighted Average Cost of Capital (WACC): A specialized sheet for computing WACC using custom inputs.
- Key Financial Ratios: Evaluate Shenzhen Everwin Precision Technology Co., Ltd.’s profitability, efficiency, and leverage.
- Customizable Inputs: Easily modify revenue growth rates, profit margins, and tax rates.
- User-Friendly Dashboard: Visual representations and tables that summarize essential valuation outcomes.
Disclaimer
All information, articles, and product details provided on this website are for general informational and educational purposes only. We do not claim any ownership over, nor do we intend to infringe upon, any trademarks, copyrights, logos, brand names, or other intellectual property mentioned or depicted on this site. Such intellectual property remains the property of its respective owners, and any references here are made solely for identification or informational purposes, without implying any affiliation, endorsement, or partnership.
We make no representations or warranties, express or implied, regarding the accuracy, completeness, or suitability of any content or products presented. Nothing on this website should be construed as legal, tax, investment, financial, medical, or other professional advice. In addition, no part of this site—including articles or product references—constitutes a solicitation, recommendation, endorsement, advertisement, or offer to buy or sell any securities, franchises, or other financial instruments, particularly in jurisdictions where such activity would be unlawful.
All content is of a general nature and may not address the specific circumstances of any individual or entity. It is not a substitute for professional advice or services. Any actions you take based on the information provided here are strictly at your own risk. You accept full responsibility for any decisions or outcomes arising from your use of this website and agree to release us from any liability in connection with your use of, or reliance upon, the content or products found herein.