
|
Tianjin Ringpu Bio-Technology Co., Ltd. (300119.sz) Évaluation DCF |
Entièrement Modifiable: Adapté À Vos Besoins Dans Excel Ou Sheets
Conception Professionnelle: Modèles Fiables Et Conformes Aux Normes Du Secteur
Pré-Construits Pour Une Utilisation Rapide Et Efficace
Compatible MAC/PC, entièrement débloqué
Aucune Expertise N'Est Requise; Facile À Suivre
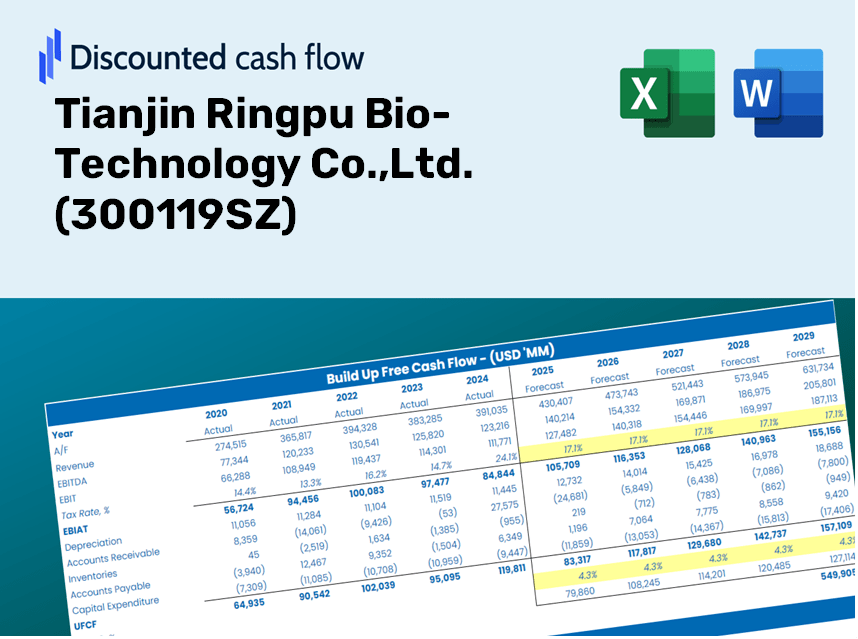
Tianjin Ringpu Bio-Technology Co.,Ltd. (300119.SZ) Bundle
Gagnez la maîtrise sur votre Tianjin Ringpu Bio-Technology Co., Ltd. (300119SZ) Analyse d'évaluation avec notre calculatrice sophistiquée DCF! Équipé de données réelles (300119SZ), ce modèle Excel vous permet d'ajuster les prévisions et les hypothèses pour déterminer avec précision la valeur intrinsèque de Tianjin Ringpu Bio-Technology Co., Ltd. (300119SZ).
Discounted Cash Flow (DCF) - (USD MM)
| Year | AY1 2020 |
AY2 2021 |
AY3 2022 |
AY4 2023 |
AY5 2024 |
FY1 2025 |
FY2 2026 |
FY3 2027 |
FY4 2028 |
FY5 2029 |
|---|---|---|---|---|---|---|---|---|---|---|
| Revenue | 2,000.4 | 2,007.1 | 2,084.3 | 2,709.1 | 3,069.9 | 3,434.3 | 3,841.9 | 4,298.0 | 4,808.1 | 5,378.8 |
| Revenue Growth, % | 0 | 0.33649 | 3.84 | 29.98 | 13.32 | 11.87 | 11.87 | 11.87 | 11.87 | 11.87 |
| EBITDA | 495.1 | 439.1 | 457.9 | 517.4 | 567.4 | 729.3 | 815.9 | 912.7 | 1,021.1 | 1,142.3 |
| EBITDA, % | 24.75 | 21.88 | 21.97 | 19.1 | 18.48 | 21.24 | 21.24 | 21.24 | 21.24 | 21.24 |
| Depreciation | 95.7 | 84.0 | 107.5 | 138.8 | 192.4 | 175.3 | 196.1 | 219.3 | 245.4 | 274.5 |
| Depreciation, % | 4.79 | 4.18 | 5.16 | 5.12 | 6.27 | 5.1 | 5.1 | 5.1 | 5.1 | 5.1 |
| EBIT | 399.4 | 355.2 | 350.4 | 378.6 | 375.0 | 554.1 | 619.8 | 693.4 | 775.7 | 867.8 |
| EBIT, % | 19.97 | 17.69 | 16.81 | 13.98 | 12.22 | 16.13 | 16.13 | 16.13 | 16.13 | 16.13 |
| Total Cash | 694.3 | 1,888.0 | 1,885.3 | 1,618.8 | 1,938.6 | 2,349.9 | 2,628.9 | 2,940.9 | 3,290.0 | 3,680.5 |
| Total Cash, percent | .0 | .0 | .0 | .0 | .0 | .0 | .0 | .0 | .0 | .0 |
| Account Receivables | 466.6 | 606.6 | .0 | 1,018.9 | 1,137.9 | 880.7 | 985.3 | 1,102.2 | 1,233.0 | 1,379.4 |
| Account Receivables, % | 23.33 | 30.22 | 0 | 37.61 | 37.07 | 25.65 | 25.65 | 25.65 | 25.65 | 25.65 |
| Inventories | 364.0 | 360.5 | 367.1 | 389.9 | 499.6 | 579.9 | 648.8 | 725.8 | 811.9 | 908.3 |
| Inventories, % | 18.2 | 17.96 | 17.61 | 14.39 | 16.27 | 16.89 | 16.89 | 16.89 | 16.89 | 16.89 |
| Accounts Payable | 22.2 | 65.4 | 148.5 | 562.0 | 550.2 | 344.5 | 385.4 | 431.2 | 482.3 | 539.6 |
| Accounts Payable, % | 1.11 | 3.26 | 7.13 | 20.74 | 17.92 | 10.03 | 10.03 | 10.03 | 10.03 | 10.03 |
| Capital Expenditure | -259.2 | -305.9 | -372.4 | -244.5 | -185.3 | -419.8 | -469.7 | -525.4 | -587.8 | -657.6 |
| Capital Expenditure, % | -12.96 | -15.24 | -17.87 | -9.02 | -6.04 | -12.23 | -12.23 | -12.23 | -12.23 | -12.23 |
| Tax Rate, % | 18.35 | 18.35 | 18.35 | 18.35 | 18.35 | 18.35 | 18.35 | 18.35 | 18.35 | 18.35 |
| EBITAT | 311.3 | 300.5 | 293.6 | 300.7 | 306.2 | 451.5 | 505.1 | 565.0 | 632.1 | 707.1 |
| Depreciation | ||||||||||
| Changes in Account Receivables | ||||||||||
| Changes in Inventories | ||||||||||
| Changes in Accounts Payable | ||||||||||
| Capital Expenditure | ||||||||||
| UFCF | -660.6 | -14.6 | 711.8 | -433.3 | 72.9 | 178.0 | 98.9 | 110.7 | 123.8 | 138.5 |
| WACC, % | 4.42 | 4.45 | 4.45 | 4.43 | 4.44 | 4.44 | 4.44 | 4.44 | 4.44 | 4.44 |
| PV UFCF | ||||||||||
| SUM PV UFCF | 573.8 | |||||||||
| Long Term Growth Rate, % | 3.00 | |||||||||
| Free cash flow (T + 1) | 143 | |||||||||
| Terminal Value | 9,923 | |||||||||
| Present Terminal Value | 7,986 | |||||||||
| Enterprise Value | 8,560 | |||||||||
| Net Debt | 832 | |||||||||
| Equity Value | 7,727 | |||||||||
| Diluted Shares Outstanding, MM | 460 | |||||||||
| Equity Value Per Share | 16.79 |
What You Will Receive
- Authentic Tianjin Ringpu Data: Preloaded financials – covering everything from revenue to EBIT – based on actual and projected figures.
- Comprehensive Customization: Modify all essential parameters (yellow cells) including WACC, growth %, and tax rates.
- Immediate Valuation Adjustments: Automatic recalculations to assess how changes affect the fair value of Tianjin Ringpu Bio-Technology Co., Ltd. (300119SZ).
- Flexible Excel Template: Designed for quick modifications, scenario analysis, and thorough projections.
- Efficient and Precise: Avoid the hassle of creating models from the ground up while ensuring accuracy and adaptability.
Key Features
- Comprehensive Data: Tianjin Ringpu’s historical financial reports and pre-populated forecasts.
- Customizable Inputs: Modify WACC, tax rates, revenue growth, and EBITDA margins as needed.
- Real-Time Results: View the intrinsic value of Tianjin Ringpu recalculated instantly.
- Intuitive Visual Outputs: Dashboard graphics showcase valuation outcomes and essential metrics.
- Designed for Precision: A professional-grade tool tailored for analysts, investors, and finance professionals.
How It Works
- Step 1: Download the Excel file.
- Step 2: Review the pre-filled data for Tianjin Ringpu Bio-Technology Co., Ltd. (300119SZ) (historical and projected).
- Step 3: Modify key assumptions (highlighted in yellow) according to your analysis.
- Step 4: Observe automatic recalculations of Tianjin Ringpu Bio-Technology's intrinsic value.
- Step 5: Utilize the results for your investment decisions or reporting purposes.
Why Choose This Calculator for Tianjin Ringpu Bio-Technology Co., Ltd. (300119SZ)?
- Reliable Data: Utilize authentic financials from Tianjin Ringpu for trustworthy valuation results.
- Customizable Features: Modify essential parameters such as growth rates, WACC, and tax rates to align with your forecasts.
- Efficient: Built-in calculations save you the hassle of starting from the ground up.
- Professional-Quality Tool: Tailored for investors, analysts, and consultants in the biotechnology sector.
- User-Friendly Interface: An intuitive design and clear, step-by-step guidance make it accessible for all users.
Who Can Benefit from Our Products?
- Investors: Make informed decisions with our advanced biotechnology solutions at Tianjin Ringpu Bio-Technology Co., Ltd. (300119SZ).
- Research Analysts: Save time utilizing our comprehensive data sets and analysis tools tailored for the biotech sector.
- Consultants: Efficiently customize our resources for impactful client presentations and strategic reports.
- Biotechnology Enthusiasts: Enhance your knowledge of biotech applications through our innovative products and insights.
- Educators and Students: Leverage our offerings as practical learning aids in biotechnology and related fields.
Contents of the Template
- Pre-Filled Data: Features historical financial data and projections for Tianjin Ringpu Bio-Technology Co.,Ltd. (300119SZ).
- Discounted Cash Flow Model: An editable DCF valuation model with automatic calculations for ease of use.
- Weighted Average Cost of Capital (WACC): A dedicated sheet to compute WACC based on your custom inputs.
- Key Financial Ratios: Assess Tianjin Ringpu's profitability, operational efficiency, and financial leverage.
- Customizable Inputs: Easily modify revenue growth rates, profit margins, and tax rates.
- Clear Dashboard: Visual representations through charts and tables that summarize essential valuation outcomes.
Disclaimer
All information, articles, and product details provided on this website are for general informational and educational purposes only. We do not claim any ownership over, nor do we intend to infringe upon, any trademarks, copyrights, logos, brand names, or other intellectual property mentioned or depicted on this site. Such intellectual property remains the property of its respective owners, and any references here are made solely for identification or informational purposes, without implying any affiliation, endorsement, or partnership.
We make no representations or warranties, express or implied, regarding the accuracy, completeness, or suitability of any content or products presented. Nothing on this website should be construed as legal, tax, investment, financial, medical, or other professional advice. In addition, no part of this site—including articles or product references—constitutes a solicitation, recommendation, endorsement, advertisement, or offer to buy or sell any securities, franchises, or other financial instruments, particularly in jurisdictions where such activity would be unlawful.
All content is of a general nature and may not address the specific circumstances of any individual or entity. It is not a substitute for professional advice or services. Any actions you take based on the information provided here are strictly at your own risk. You accept full responsibility for any decisions or outcomes arising from your use of this website and agree to release us from any liability in connection with your use of, or reliance upon, the content or products found herein.