
|
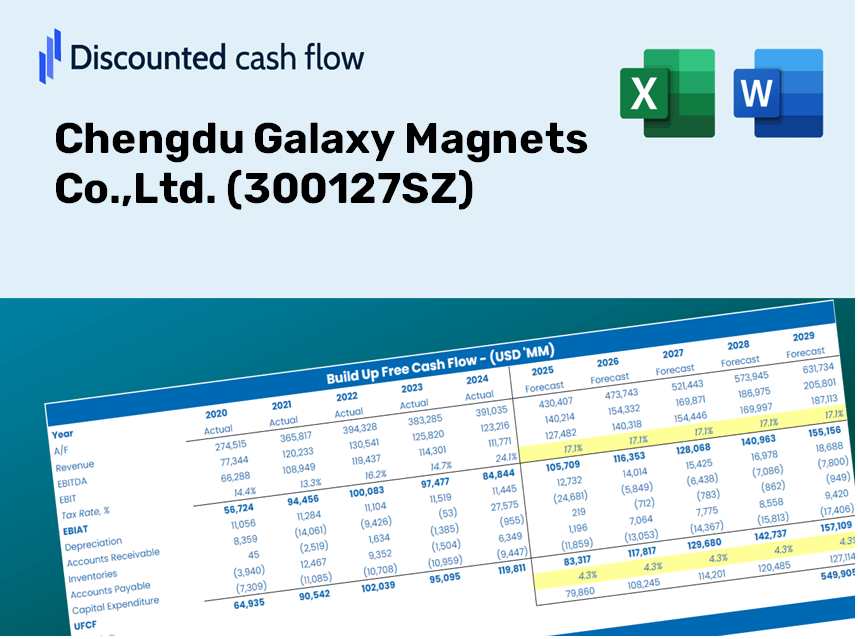
Chengdu Galaxy Magnets Co.,Ltd. (300127.SZ) DCF Valuation |
Entièrement Modifiable: Adapté À Vos Besoins Dans Excel Ou Sheets
Conception Professionnelle: Modèles Fiables Et Conformes Aux Normes Du Secteur
Pré-Construits Pour Une Utilisation Rapide Et Efficace
Compatible MAC/PC, entièrement débloqué
Aucune Expertise N'Est Requise; Facile À Suivre
Chengdu Galaxy Magnets Co.,Ltd. (300127.SZ) Bundle
Discover the true potential of Chengdu Galaxy Magnets Co., Ltd. (300127SZ) with our advanced DCF Calculator! Adjust key assumptions, explore various scenarios, and evaluate how different factors influence Chengdu Galaxy Magnets Co., Ltd. (300127SZ) valuation – all within a single Excel template.
Discounted Cash Flow (DCF) - (USD MM)
| Year | AY1 2020 |
AY2 2021 |
AY3 2022 |
AY4 2023 |
AY5 2024 |
FY1 2025 |
FY2 2026 |
FY3 2027 |
FY4 2028 |
FY5 2029 |
|---|---|---|---|---|---|---|---|---|---|---|
| Revenue | 604.3 | 861.1 | 992.1 | 823.9 | 798.9 | 825.5 | 853.0 | 881.4 | 910.7 | 941.0 |
| Revenue Growth, % | 0 | 42.51 | 15.21 | -16.95 | -3.04 | 3.33 | 3.33 | 3.33 | 3.33 | 3.33 |
| EBITDA | 173.5 | 231.5 | 191.5 | 187.1 | 175.7 | 197.4 | 204.0 | 210.8 | 217.8 | 225.1 |
| EBITDA, % | 28.71 | 26.88 | 19.3 | 22.71 | 21.99 | 23.92 | 23.92 | 23.92 | 23.92 | 23.92 |
| Depreciation | 20.3 | 23.8 | 28.4 | 28.7 | 29.9 | 32.1 | 34.5 | 36.9 | 39.5 | 42.2 |
| Depreciation, % | 3.35 | 2.76 | 2.86 | 3.48 | 3.74 | 3.89 | 4.04 | 4.19 | 4.33 | 4.48 |
| EBIT | 153.2 | 207.7 | 163.1 | 158.5 | 145.8 | 170.7 | 176.4 | 182.2 | 188.3 | 194.6 |
| EBIT, % | 25.35 | 24.11 | 16.44 | 19.23 | 18.25 | 20.68 | 20.68 | 20.68 | 20.68 | 20.68 |
| Total Cash | 647.9 | 608.7 | 618.1 | 560.6 | 608.9 | 622.8 | 643.6 | 665.0 | 687.1 | 710.0 |
| Total Cash, percent | .0 | .0 | .0 | .0 | .0 | .0 | .0 | .0 | .0 | .0 |
| Account Receivables | 241.0 | 287.0 | 364.2 | 380.8 | 307.4 | 326.1 | 345.5 | 365.8 | 386.9 | 408.8 |
| Account Receivables, % | 39.89 | 33.33 | 36.71 | 46.22 | 38.47 | 39.5 | 40.51 | 41.5 | 42.48 | 43.44 |
| Inventories | 127.5 | 208.6 | 176.9 | 296.4 | 245.5 | 277.7 | 310.7 | 344.5 | 379.3 | 414.9 |
| Inventories, % | 21.09 | 24.23 | 17.83 | 35.98 | 30.73 | 33.63 | 36.42 | 39.09 | 41.65 | 44.1 |
| Accounts Payable | 30.3 | 60.1 | 68.3 | 35.9 | 49.6 | 48.6 | 50.2 | 51.9 | 53.6 | 55.4 |
| Accounts Payable, % | 5.02 | 6.98 | 6.88 | 4.35 | 6.21 | 5.89 | 5.89 | 5.89 | 5.89 | 5.89 |
| Capital Expenditure | -69.0 | -77.1 | -54.7 | -24.5 | -44.8 | -56.9 | -58.8 | -60.8 | -62.8 | -64.9 |
| Capital Expenditure, % | -11.42 | -8.96 | -5.52 | -2.98 | -5.61 | -6.9 | -6.9 | -6.9 | -6.9 | -6.9 |
| Tax Rate, % | 10.39 | 10.39 | 10.39 | 10.39 | 10.39 | 10.39 | 10.39 | 10.39 | 10.39 | 10.39 |
| EBITAT | 131.0 | 179.3 | 143.9 | 141.9 | 130.6 | 149.9 | 154.9 | 160.1 | 165.4 | 170.9 |
| Depreciation | ||||||||||
| Changes in Account Receivables | ||||||||||
| Changes in Inventories | ||||||||||
| Changes in Accounts Payable | ||||||||||
| Capital Expenditure | ||||||||||
| UFCF | -255.9 | 28.6 | 80.2 | -22.5 | 253.9 | 73.3 | 79.7 | 83.8 | 88.0 | 92.4 |
| WACC, % | 5.33 | 5.33 | 5.33 | 5.33 | 5.33 | 5.33 | 5.33 | 5.33 | 5.33 | 5.33 |
| PV UFCF | ||||||||||
| SUM PV UFCF | 355.9 | |||||||||
| Long Term Growth Rate, % | 3.50 | |||||||||
| Free cash flow (T + 1) | 96 | |||||||||
| Terminal Value | 5,232 | |||||||||
| Present Terminal Value | 4,036 | |||||||||
| Enterprise Value | 4,392 | |||||||||
| Net Debt | -607 | |||||||||
| Equity Value | 4,999 | |||||||||
| Diluted Shares Outstanding, MM | 320 | |||||||||
| Equity Value Per Share | 15.62 |
What You Will Receive
- Customizable Excel Template: An entirely adjustable Excel-based DCF Calculator featuring pre-filled financial data for Chengdu Galaxy Magnets Co.,Ltd. (300127SZ).
- Authentic Data: Access to historical information and forward-looking projections (highlighted in the yellow cells).
- Adjustable Forecasts: Modify assumptions for revenue growth, EBITDA margin, and WACC as needed.
- Instant Calculations: Quickly assess how changes in your inputs affect Chengdu Galaxy Magnets Co.,Ltd. (300127SZ)'s valuation.
- Professional Resource: Designed specifically for investors, CFOs, consultants, and financial analysts.
- User-Centric Layout: Organized for straightforward navigation, complete with detailed instructions.
Key Features
- 🔍 Real-Time Financials for Chengdu Galaxy Magnets: Pre-filled historical and projected financial data for Chengdu Galaxy Magnets Co., Ltd. (300127SZ).
- ✏️ Fully Customizable Parameters: Modify all essential inputs (highlighted cells) such as WACC, growth rate, and tax percentages.
- 📊 Comprehensive DCF Valuation: Integrated formulas compute Chengdu Galaxy Magnets' intrinsic value using the Discounted Cash Flow approach.
- ⚡ Immediate Insights: Visualize the valuation of Chengdu Galaxy Magnets instantly upon adjusting inputs.
- Scenario Analysis: Evaluate and compare potential outcomes based on different financial assumptions side-by-side.
How It Works
- Step 1: Download the prebuilt Excel template containing Chengdu Galaxy Magnets Co., Ltd.'s data.
- Step 2: Review the pre-filled sheets to familiarize yourself with the key performance indicators.
- Step 3: Adjust forecasts and assumptions in the editable yellow cells (WACC, growth, margins).
- Step 4: Instantly see the recalculated outcomes, including Chengdu Galaxy Magnets Co., Ltd.'s intrinsic value.
- Step 5: Use the results to make well-informed investment decisions or generate reports.
Why Choose Chengdu Galaxy Magnets Co., Ltd. (300127SZ)?
- Designed for Experts: A sophisticated tool utilized by industry analysts, CFOs, and consultants.
- Accurate Market Data: Preloaded historical and forecasted financials specific to Chengdu Galaxy Magnets for reliable insights.
- Flexible Scenario Analysis: Easily test various forecasts and assumptions to evaluate potential outcomes.
- Intuitive Outputs: Instantly computes intrinsic value, NPV, and essential financial metrics.
- User-Friendly Experience: Clear, step-by-step guidance simplifies the calculation process.
Who Can Benefit from This Product?
- Investors: Assess the fair value of Chengdu Galaxy Magnets Co., Ltd. (300127SZ) before making investment choices.
- CFOs: Utilize a high-quality DCF model for financial statements and analysis.
- Consultants: Easily customize the template for client valuation reports.
- Entrepreneurs: Learn about financial modeling practices employed by major corporations.
- Educators: Employ it as a resource to teach valuation techniques.
Contents of the Template
- Pre-Filled DCF Model: Chengdu Galaxy Magnets Co., Ltd. (300127SZ) financial data ready for instant use.
- WACC Calculator: Comprehensive calculations for the Weighted Average Cost of Capital.
- Financial Ratios: Analyze profitability, leverage, and efficiency metrics for Chengdu Galaxy Magnets Co., Ltd. (300127SZ).
- Editable Inputs: Modify assumptions such as growth rates, margins, and capital expenditures to suit your analyses.
- Financial Statements: Access annual and quarterly reports for in-depth examination.
- Interactive Dashboard: Effortlessly visualize crucial valuation metrics and outcomes.
Disclaimer
All information, articles, and product details provided on this website are for general informational and educational purposes only. We do not claim any ownership over, nor do we intend to infringe upon, any trademarks, copyrights, logos, brand names, or other intellectual property mentioned or depicted on this site. Such intellectual property remains the property of its respective owners, and any references here are made solely for identification or informational purposes, without implying any affiliation, endorsement, or partnership.
We make no representations or warranties, express or implied, regarding the accuracy, completeness, or suitability of any content or products presented. Nothing on this website should be construed as legal, tax, investment, financial, medical, or other professional advice. In addition, no part of this site—including articles or product references—constitutes a solicitation, recommendation, endorsement, advertisement, or offer to buy or sell any securities, franchises, or other financial instruments, particularly in jurisdictions where such activity would be unlawful.
All content is of a general nature and may not address the specific circumstances of any individual or entity. It is not a substitute for professional advice or services. Any actions you take based on the information provided here are strictly at your own risk. You accept full responsibility for any decisions or outcomes arising from your use of this website and agree to release us from any liability in connection with your use of, or reliance upon, the content or products found herein.