
|
Songcheng Performance Development Co., Ltd (300144.SZ) Évaluation DCF |
Entièrement Modifiable: Adapté À Vos Besoins Dans Excel Ou Sheets
Conception Professionnelle: Modèles Fiables Et Conformes Aux Normes Du Secteur
Pré-Construits Pour Une Utilisation Rapide Et Efficace
Compatible MAC/PC, entièrement débloqué
Aucune Expertise N'Est Requise; Facile À Suivre
Songcheng Performance Development Co.,Ltd (300144.SZ) Bundle
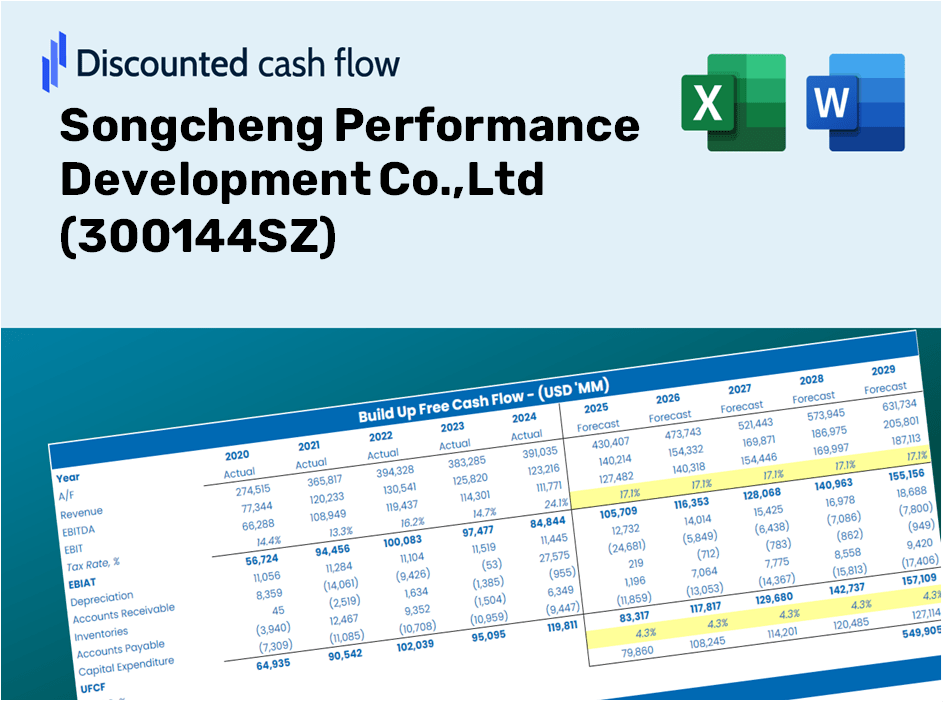
Gardez un aperçu de votre analyse d'évaluation de votre Songcheng Performance Development Co., Ltd (300144SZ) à l'aide de notre calculatrice sophistiquée DCF! Équipé de données réelles (300144SZ), ce modèle Excel vous permet d'ajuster avec précision les prévisions et les hypothèses pour déterminer la valeur intrinsèque de Songcheng.
Discounted Cash Flow (DCF) - (USD MM)
| Year | AY1 2020 |
AY2 2021 |
AY3 2022 |
AY4 2023 |
AY5 2024 |
FY1 2025 |
FY2 2026 |
FY3 2027 |
FY4 2028 |
FY5 2029 |
|---|---|---|---|---|---|---|---|---|---|---|
| Revenue | 902.6 | 1,184.9 | 457.8 | 1,926.3 | 2,417.3 | 2,993.8 | 3,707.8 | 4,592.1 | 5,687.3 | 7,043.7 |
| Revenue Growth, % | 0 | 31.27 | -61.36 | 320.76 | 25.49 | 23.85 | 23.85 | 23.85 | 23.85 | 23.85 |
| EBITDA | -1,428.9 | 703.6 | 273.3 | 377.4 | 1,634.5 | 636.5 | 788.3 | 976.3 | 1,209.1 | 1,497.5 |
| EBITDA, % | -158.31 | 59.39 | 59.7 | 19.59 | 67.62 | 21.26 | 21.26 | 21.26 | 21.26 | 21.26 |
| Depreciation | 293.1 | 386.8 | 392.8 | 306.0 | 312.5 | 1,076.1 | 1,332.7 | 1,650.6 | 2,044.3 | 2,531.8 |
| Depreciation, % | 32.47 | 32.64 | 85.79 | 15.88 | 12.93 | 35.94 | 35.94 | 35.94 | 35.94 | 35.94 |
| EBIT | -1,722.0 | 316.9 | -119.5 | 71.4 | 1,322.0 | -245.2 | -303.7 | -376.1 | -465.8 | -576.9 |
| EBIT, % | -190.78 | 26.74 | -26.09 | 3.71 | 54.69 | -8.19 | -8.19 | -8.19 | -8.19 | -8.19 |
| Total Cash | 1,673.0 | 1,861.4 | 2,552.6 | 3,292.1 | 4,041.3 | 2,993.8 | 3,707.8 | 4,592.1 | 5,687.3 | 7,043.7 |
| Total Cash, percent | .0 | .0 | .0 | .0 | .0 | .0 | .0 | .0 | .0 | .0 |
| Account Receivables | 56.4 | 12.4 | 1.0 | 5.1 | 35.1 | 55.2 | 68.4 | 84.7 | 104.9 | 129.9 |
| Account Receivables, % | 6.25 | 1.05 | 0.21134 | 0.26379 | 1.45 | 1.84 | 1.84 | 1.84 | 1.84 | 1.84 |
| Inventories | 13.4 | 12.5 | 11.0 | 9.0 | 7.5 | 34.3 | 42.5 | 52.6 | 65.2 | 80.8 |
| Inventories, % | 1.49 | 1.06 | 2.41 | 0.46568 | 0.31034 | 1.15 | 1.15 | 1.15 | 1.15 | 1.15 |
| Accounts Payable | 372.5 | 482.0 | 327.4 | 256.4 | 293.2 | 1,071.2 | 1,326.7 | 1,643.1 | 2,035.0 | 2,520.3 |
| Accounts Payable, % | 41.27 | 40.68 | 71.52 | 13.31 | 12.13 | 35.78 | 35.78 | 35.78 | 35.78 | 35.78 |
| Capital Expenditure | -1,017.9 | -693.8 | -245.7 | -396.5 | -327.5 | -1,475.0 | -1,826.8 | -2,262.5 | -2,802.1 | -3,470.4 |
| Capital Expenditure, % | -112.78 | -58.56 | -53.66 | -20.58 | -13.55 | -49.27 | -49.27 | -49.27 | -49.27 | -49.27 |
| Tax Rate, % | 19.48 | 19.48 | 19.48 | 19.48 | 19.48 | 19.48 | 19.48 | 19.48 | 19.48 | 19.48 |
| EBITAT | -1,751.6 | 290.4 | -149.5 | -181.7 | 1,064.5 | -182.5 | -226.0 | -279.9 | -346.7 | -429.4 |
| Depreciation | ||||||||||
| Changes in Account Receivables | ||||||||||
| Changes in Inventories | ||||||||||
| Changes in Accounts Payable | ||||||||||
| Capital Expenditure | ||||||||||
| UFCF | -2,173.7 | 137.7 | -144.0 | -345.2 | 1,057.7 | 149.6 | -486.0 | -601.9 | -745.5 | -923.3 |
| WACC, % | 7.48 | 7.47 | 7.48 | 7.38 | 7.46 | 7.45 | 7.45 | 7.45 | 7.45 | 7.45 |
| PV UFCF | ||||||||||
| SUM PV UFCF | -1,970.7 | |||||||||
| Long Term Growth Rate, % | 2.00 | |||||||||
| Free cash flow (T + 1) | -942 | |||||||||
| Terminal Value | -17,275 | |||||||||
| Present Terminal Value | -12,060 | |||||||||
| Enterprise Value | -14,031 | |||||||||
| Net Debt | -2,580 | |||||||||
| Equity Value | -11,451 | |||||||||
| Diluted Shares Outstanding, MM | 2,616 | |||||||||
| Equity Value Per Share | -4.38 |
What You Will Receive
- Adjustable Forecast Parameters: Modify key assumptions (growth %, margins, WACC) effortlessly to explore various scenarios.
- Comprehensive Data: Access Songcheng Performance Development Co., Ltd's (300144SZ) financial data pre-loaded to kickstart your analysis.
- Instant DCF Outputs: The model automatically computes Net Present Value (NPV) and intrinsic value for your convenience.
- Professional and Tailored: A sleek Excel model designed to meet your specific valuation requirements.
- Engineered for Analysts and Investors: Perfect for evaluating forecasts, affirming strategies, and enhancing efficiency.
Key Features
- Comprehensive Financial Data: Gain access to precise historical figures and future forecasts tailored for Songcheng Performance Development Co., Ltd (300144SZ).
- Tailored Forecast Parameters: Modify highlighted fields to suit your analysis, including WACC, growth rates, and profit margins.
- Real-Time Calculations: Automatic adjustments to DCF, Net Present Value (NPV), and cash flow evaluations as inputs change.
- Interactive Dashboard: User-friendly charts and summaries for a clear perspective on your valuation outcomes.
- Designed for All Levels: A straightforward, intuitive framework catering to investors, CFOs, and consultants alike.
How It Works
- Download: Obtain the pre-configured Excel file featuring Songcheng Performance Development Co., Ltd's (300144SZ) financial data.
- Customize: Modify forecasts, such as revenue growth, EBITDA %, and WACC as per your analysis.
- Update Automatically: Real-time updates for intrinsic value and NPV calculations are provided.
- Test Scenarios: Develop various projections and evaluate different outcomes instantly.
- Make Decisions: Leverage the valuation findings to inform your investment strategy.
Why Opt for This Calculator?
- Reliable Data: Accurate financials from Songcheng Performance Development Co., Ltd (300144SZ) guarantee trustworthy valuation outcomes.
- Flexible Options: Tailor essential variables such as growth rates, WACC, and tax rates to align with your forecasts.
- Efficient: Built-in calculations save you the effort of starting from square one.
- Expert Tool: Crafted specifically for investors, analysts, and consultants.
- Easy to Use: Streamlined design and clear instructions ensure accessibility for all users.
Who Can Benefit from This Product?
- Individual Investors: Gain insights to make informed decisions about investing in Songcheng Performance Development Co., Ltd (300144SZ).
- Financial Analysts: Enhance valuation methods with easily accessible financial models tailored for (300144SZ).
- Consultants: Provide clients with accurate and timely valuation insights related to (300144SZ).
- Business Owners: Learn how major firms like Songcheng are valued to inform your own business strategies.
- Finance Students: Develop valuation skills using actual data and case studies involving (300144SZ).
What the Template Includes
- Preloaded Songcheng Data: Historical and projected financial metrics, including revenue, EBIT, and capital expenditures.
- DCF and WACC Models: Advanced templates designed for calculating intrinsic value and Weighted Average Cost of Capital.
- Editable Inputs: Cells highlighted in yellow for modifying revenue growth rates, tax rates, and discount rates.
- Financial Statements: Detailed annual and quarterly financial reports for in-depth analysis.
- Key Ratios: Ratios related to profitability, leverage, and efficiency to assess performance.
- Dashboard and Charts: Visual representations of valuation results and underlying assumptions.
Disclaimer
All information, articles, and product details provided on this website are for general informational and educational purposes only. We do not claim any ownership over, nor do we intend to infringe upon, any trademarks, copyrights, logos, brand names, or other intellectual property mentioned or depicted on this site. Such intellectual property remains the property of its respective owners, and any references here are made solely for identification or informational purposes, without implying any affiliation, endorsement, or partnership.
We make no representations or warranties, express or implied, regarding the accuracy, completeness, or suitability of any content or products presented. Nothing on this website should be construed as legal, tax, investment, financial, medical, or other professional advice. In addition, no part of this site—including articles or product references—constitutes a solicitation, recommendation, endorsement, advertisement, or offer to buy or sell any securities, franchises, or other financial instruments, particularly in jurisdictions where such activity would be unlawful.
All content is of a general nature and may not address the specific circumstances of any individual or entity. It is not a substitute for professional advice or services. Any actions you take based on the information provided here are strictly at your own risk. You accept full responsibility for any decisions or outcomes arising from your use of this website and agree to release us from any liability in connection with your use of, or reliance upon, the content or products found herein.