
|
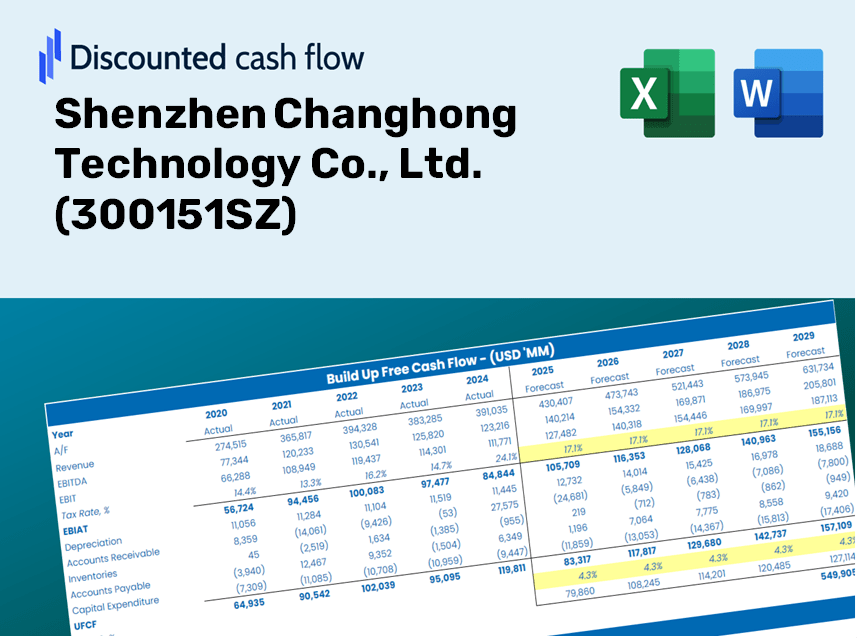
Shenzhen Changhong Technology Co., Ltd. (300151.SZ) Valation DCF |
Entièrement Modifiable: Adapté À Vos Besoins Dans Excel Ou Sheets
Conception Professionnelle: Modèles Fiables Et Conformes Aux Normes Du Secteur
Pré-Construits Pour Une Utilisation Rapide Et Efficace
Compatible MAC/PC, entièrement débloqué
Aucune Expertise N'Est Requise; Facile À Suivre
Shenzhen Changhong Technology Co., Ltd. (300151.SZ) Bundle
Rationalisez votre analyse et améliorez la précision avec notre calculatrice DCF (300151SZ)! En utilisant des données authentiques de Shenzhen Changhong Technology Co., Ltd. et des hypothèses personnalisables, cet outil vous permet de prévoir, analyser et valoriser (300151SZ) comme un investisseur chevronné.
Discounted Cash Flow (DCF) - (USD MM)
| Year | AY1 2020 |
AY2 2021 |
AY3 2022 |
AY4 2023 |
AY5 2024 |
FY1 2025 |
FY2 2026 |
FY3 2027 |
FY4 2028 |
FY5 2029 |
|---|---|---|---|---|---|---|---|---|---|---|
| Revenue | 1,118.0 | 1,127.4 | 1,228.3 | 931.3 | 1,038.9 | 1,031.5 | 1,024.2 | 1,017.0 | 1,009.7 | 1,002.6 |
| Revenue Growth, % | 0 | 0.83752 | 8.95 | -24.18 | 11.56 | -0.70894 | -0.70894 | -0.70894 | -0.70894 | -0.70894 |
| EBITDA | 259.2 | 220.5 | 243.8 | 143.3 | 207.3 | 202.1 | 200.6 | 199.2 | 197.8 | 196.4 |
| EBITDA, % | 23.18 | 19.56 | 19.85 | 15.39 | 19.95 | 19.59 | 19.59 | 19.59 | 19.59 | 19.59 |
| Depreciation | 49.2 | 70.3 | 76.0 | 79.1 | 74.5 | 67.0 | 66.6 | 66.1 | 65.6 | 65.2 |
| Depreciation, % | 4.4 | 6.24 | 6.19 | 8.5 | 7.17 | 6.5 | 6.5 | 6.5 | 6.5 | 6.5 |
| EBIT | 210.0 | 150.3 | 167.8 | 64.2 | 132.7 | 135.0 | 134.1 | 133.1 | 132.2 | 131.2 |
| EBIT, % | 18.78 | 13.33 | 13.66 | 6.9 | 12.78 | 13.09 | 13.09 | 13.09 | 13.09 | 13.09 |
| Total Cash | 333.2 | 657.6 | 624.9 | 897.5 | 492.1 | 583.3 | 579.2 | 575.1 | 571.0 | 567.0 |
| Total Cash, percent | .0 | .0 | .0 | .0 | .0 | .0 | .0 | .0 | .0 | .0 |
| Account Receivables | 200.0 | 247.4 | 295.7 | 225.5 | 244.0 | 230.2 | 228.6 | 227.0 | 225.4 | 223.8 |
| Account Receivables, % | 17.89 | 21.94 | 24.07 | 24.22 | 23.49 | 22.32 | 22.32 | 22.32 | 22.32 | 22.32 |
| Inventories | 146.1 | 187.1 | 189.2 | 144.6 | 170.1 | 158.8 | 157.7 | 156.6 | 155.4 | 154.3 |
| Inventories, % | 13.07 | 16.6 | 15.4 | 15.53 | 16.37 | 15.39 | 15.39 | 15.39 | 15.39 | 15.39 |
| Accounts Payable | 113.1 | 136.5 | 151.4 | 113.5 | 118.0 | 119.9 | 119.0 | 118.2 | 117.3 | 116.5 |
| Accounts Payable, % | 10.12 | 12.11 | 12.33 | 12.19 | 11.36 | 11.62 | 11.62 | 11.62 | 11.62 | 11.62 |
| Capital Expenditure | -158.6 | -196.8 | -352.0 | -232.8 | -228.6 | -221.4 | -219.8 | -218.3 | -216.7 | -215.2 |
| Capital Expenditure, % | -14.18 | -17.46 | -28.66 | -25 | -22 | -21.46 | -21.46 | -21.46 | -21.46 | -21.46 |
| Tax Rate, % | -0.0284153 | -0.0284153 | -0.0284153 | -0.0284153 | -0.0284153 | -0.0284153 | -0.0284153 | -0.0284153 | -0.0284153 | -0.0284153 |
| EBITAT | 164.8 | 128.6 | 152.4 | 57.0 | 132.8 | 119.8 | 118.9 | 118.1 | 117.3 | 116.4 |
| Depreciation | ||||||||||
| Changes in Account Receivables | ||||||||||
| Changes in Inventories | ||||||||||
| Changes in Accounts Payable | ||||||||||
| Capital Expenditure | ||||||||||
| UFCF | -177.5 | -62.9 | -159.1 | -19.9 | -60.8 | -7.6 | -32.4 | -32.2 | -31.9 | -31.7 |
| WACC, % | 7.73 | 7.76 | 7.78 | 7.77 | 7.82 | 7.77 | 7.77 | 7.77 | 7.77 | 7.77 |
| PV UFCF | ||||||||||
| SUM PV UFCF | -106.1 | |||||||||
| Long Term Growth Rate, % | 4.00 | |||||||||
| Free cash flow (T + 1) | -33 | |||||||||
| Terminal Value | -874 | |||||||||
| Present Terminal Value | -601 | |||||||||
| Enterprise Value | -707 | |||||||||
| Net Debt | 207 | |||||||||
| Equity Value | -915 | |||||||||
| Diluted Shares Outstanding, MM | 537 | |||||||||
| Equity Value Per Share | -1.70 |
What You Will Receive
- Authentic 300151SZ Financial Data: Pre-loaded with Shenzhen Changhong Technology’s historical and forecasted data for accurate analysis.
- Completely Customizable Template: Easily adjust key metrics such as revenue growth, WACC, and EBITDA percentage.
- Instant Calculations: Watch Shenzhen Changhong Technology’s intrinsic value refresh in real-time with your updates.
- Professional Valuation Tool: Crafted for investors, analysts, and consultants in search of precise DCF results.
- User-Friendly Interface: Intuitive layout and easy-to-follow instructions cater to users of all skill levels.
Key Features
- Comprehensive DCF Calculator: Features both unlevered and levered DCF valuation models tailored for Shenzhen Changhong Technology Co., Ltd. (300151SZ).
- WACC Calculator: A pre-assembled Weighted Average Cost of Capital sheet with adjustable inputs to fit your valuation needs.
- Customizable Forecast Parameters: Easily adjust growth rates, capital expenditures, and discount rates specific to Shenzhen Changhong Technology Co., Ltd. (300151SZ).
- Integrated Financial Ratios: Evaluate profitability, leverage, and efficiency ratios relevant to Shenzhen Changhong Technology Co., Ltd. (300151SZ).
- Interactive Dashboard and Graphs: Visual representations that distill crucial valuation metrics for streamlined analysis.
How It Functions
- Download: Get the pre-configured Excel file containing Shenzhen Changhong Technology Co., Ltd.'s (300151SZ) financial data.
- Customize: Modify projections, including revenue growth, EBITDA percentage, and WACC.
- Update Automatically: Live calculations for intrinsic value and NPV adjust in real-time.
- Test Scenarios: Generate various projections and evaluate results instantly.
- Make Decisions: Utilize the valuation insights to inform your investment approach.
Why Select Shenzhen Changhong Technology Co., Ltd. [300151SZ]?
- Time Efficient: Skip the hassle of building a model from scratch – it’s ready for immediate use.
- Enhanced Accuracy: Dependable financial data and formulas minimize valuation errors.
- Completely Customizable: Adjust the model to align with your unique assumptions and forecasts.
- User-Friendly Insights: Intuitive charts and outputs facilitate straightforward analysis of results.
- Endorsed by Professionals: Crafted for experts who prioritize precision and ease of use.
Who Should Use This Product?
- Investors: Accurately assess the fair value of Shenzhen Changhong Technology Co., Ltd. (300151SZ) to inform your investment choices.
- CFOs: Utilize a robust DCF model for precise financial reporting and analysis related to Shenzhen Changhong Technology Co., Ltd. (300151SZ).
- Consultants: Efficiently modify the template for client valuation reports focused on Shenzhen Changhong Technology Co., Ltd. (300151SZ).
- Entrepreneurs: Acquire knowledge about financial modeling practices utilized by major corporations through the lens of Shenzhen Changhong Technology Co., Ltd. (300151SZ).
- Educators: Implement this resource as a teaching aid to illustrate valuation techniques relevant to Shenzhen Changhong Technology Co., Ltd. (300151SZ).
What the Template Contains
- Pre-Filled Data: Comprehensive financial history and forecasts for Shenzhen Changhong Technology Co., Ltd. (300151SZ).
- Discounted Cash Flow Model: An editable DCF valuation model featuring automated calculations.
- Weighted Average Cost of Capital (WACC): A specialized sheet for determining WACC based on your custom inputs.
- Key Financial Ratios: Evaluate Shenzhen Changhong’s profitability, efficiency, and leverage metrics.
- Customizable Inputs: Easily modify revenue growth rates, profit margins, and tax percentages.
- Clear Dashboard: Visual representations of key valuation outcomes through charts and tables.
Disclaimer
All information, articles, and product details provided on this website are for general informational and educational purposes only. We do not claim any ownership over, nor do we intend to infringe upon, any trademarks, copyrights, logos, brand names, or other intellectual property mentioned or depicted on this site. Such intellectual property remains the property of its respective owners, and any references here are made solely for identification or informational purposes, without implying any affiliation, endorsement, or partnership.
We make no representations or warranties, express or implied, regarding the accuracy, completeness, or suitability of any content or products presented. Nothing on this website should be construed as legal, tax, investment, financial, medical, or other professional advice. In addition, no part of this site—including articles or product references—constitutes a solicitation, recommendation, endorsement, advertisement, or offer to buy or sell any securities, franchises, or other financial instruments, particularly in jurisdictions where such activity would be unlawful.
All content is of a general nature and may not address the specific circumstances of any individual or entity. It is not a substitute for professional advice or services. Any actions you take based on the information provided here are strictly at your own risk. You accept full responsibility for any decisions or outcomes arising from your use of this website and agree to release us from any liability in connection with your use of, or reliance upon, the content or products found herein.