
|
Fujian Yuanli Active Carbon Co., Ltd. (300174.SZ) Évaluation DCF |
Entièrement Modifiable: Adapté À Vos Besoins Dans Excel Ou Sheets
Conception Professionnelle: Modèles Fiables Et Conformes Aux Normes Du Secteur
Pré-Construits Pour Une Utilisation Rapide Et Efficace
Compatible MAC/PC, entièrement débloqué
Aucune Expertise N'Est Requise; Facile À Suivre
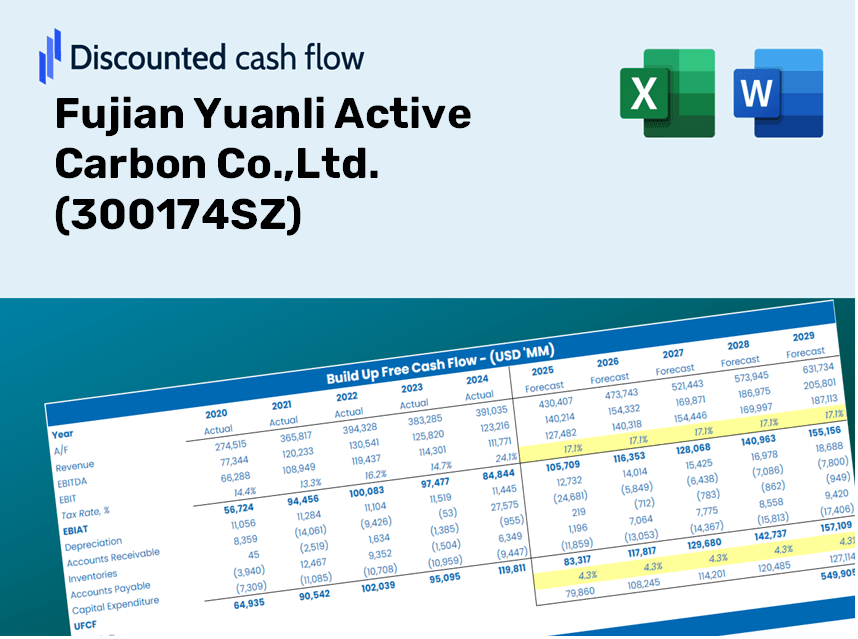
Fujian Yuanli Active Carbon Co.,Ltd. (300174.SZ) Bundle
Que vous soyez un investisseur ou un analyste, cette calculatrice DCF (300174SZ) est votre ressource incontournable pour une évaluation précise. Préchargé avec Fujian Yuanli Active Carbon Co., Ltd. Données réelles, vous pouvez ajuster les prévisions et observer les effets en temps réel.
Discounted Cash Flow (DCF) - (USD MM)
| Year | AY1 2020 |
AY2 2021 |
AY3 2022 |
AY4 2023 |
AY5 2024 |
FY1 2025 |
FY2 2026 |
FY3 2027 |
FY4 2028 |
FY5 2029 |
|---|---|---|---|---|---|---|---|---|---|---|
| Revenue | 1,136.0 | 1,608.0 | 1,951.0 | 2,015.5 | 1,883.0 | 2,163.6 | 2,486.0 | 2,856.5 | 3,282.1 | 3,771.3 |
| Revenue Growth, % | 0 | 41.55 | 21.33 | 3.3 | -6.57 | 14.9 | 14.9 | 14.9 | 14.9 | 14.9 |
| EBITDA | 234.9 | 302.2 | 391.4 | 449.7 | 471.0 | 462.4 | 531.3 | 610.5 | 701.5 | 806.0 |
| EBITDA, % | 20.68 | 18.8 | 20.06 | 22.31 | 25.01 | 21.37 | 21.37 | 21.37 | 21.37 | 21.37 |
| Depreciation | 81.8 | 109.6 | 126.7 | 133.0 | 144.6 | 150.5 | 173.0 | 198.7 | 228.4 | 262.4 |
| Depreciation, % | 7.2 | 6.82 | 6.49 | 6.6 | 7.68 | 6.96 | 6.96 | 6.96 | 6.96 | 6.96 |
| EBIT | 153.1 | 192.6 | 264.7 | 316.8 | 326.4 | 311.9 | 358.4 | 411.8 | 473.1 | 543.6 |
| EBIT, % | 13.48 | 11.98 | 13.57 | 15.72 | 17.33 | 14.41 | 14.41 | 14.41 | 14.41 | 14.41 |
| Total Cash | 621.6 | 1,450.0 | 1,458.9 | 1,536.3 | 245.9 | 1,336.9 | 1,536.1 | 1,765.0 | 2,028.1 | 2,330.3 |
| Total Cash, percent | .0 | .0 | .0 | .0 | .0 | .0 | .0 | .0 | .0 | .0 |
| Account Receivables | 224.6 | 279.2 | 286.7 | 371.1 | 425.6 | 401.8 | 461.6 | 530.4 | 609.5 | 700.3 |
| Account Receivables, % | 19.77 | 17.36 | 14.69 | 18.41 | 22.6 | 18.57 | 18.57 | 18.57 | 18.57 | 18.57 |
| Inventories | 161.4 | 227.0 | 311.5 | 281.0 | 259.5 | 311.6 | 358.1 | 411.4 | 472.7 | 543.2 |
| Inventories, % | 14.21 | 14.12 | 15.97 | 13.94 | 13.78 | 14.4 | 14.4 | 14.4 | 14.4 | 14.4 |
| Accounts Payable | 99.3 | 117.6 | 117.6 | 136.7 | 123.2 | 153.2 | 176.0 | 202.3 | 232.4 | 267.1 |
| Accounts Payable, % | 8.74 | 7.31 | 6.03 | 6.78 | 6.54 | 7.08 | 7.08 | 7.08 | 7.08 | 7.08 |
| Capital Expenditure | -225.6 | -252.7 | -298.9 | -253.8 | -218.8 | -325.0 | -373.4 | -429.1 | -493.0 | -566.5 |
| Capital Expenditure, % | -19.86 | -15.71 | -15.32 | -12.59 | -11.62 | -15.02 | -15.02 | -15.02 | -15.02 | -15.02 |
| Tax Rate, % | 10.98 | 10.98 | 10.98 | 10.98 | 10.98 | 10.98 | 10.98 | 10.98 | 10.98 | 10.98 |
| EBITAT | 98.8 | 149.4 | 209.3 | 242.8 | 290.5 | 241.3 | 277.2 | 318.6 | 366.0 | 420.6 |
| Depreciation | ||||||||||
| Changes in Account Receivables | ||||||||||
| Changes in Inventories | ||||||||||
| Changes in Accounts Payable | ||||||||||
| Capital Expenditure | ||||||||||
| UFCF | -331.7 | -95.6 | -54.8 | 87.0 | 169.9 | 68.5 | -6.7 | -7.7 | -8.9 | -10.2 |
| WACC, % | 7.48 | 7.51 | 7.51 | 7.51 | 7.53 | 7.51 | 7.51 | 7.51 | 7.51 | 7.51 |
| PV UFCF | ||||||||||
| SUM PV UFCF | 38.0 | |||||||||
| Long Term Growth Rate, % | 3.00 | |||||||||
| Free cash flow (T + 1) | -10 | |||||||||
| Terminal Value | -233 | |||||||||
| Present Terminal Value | -162 | |||||||||
| Enterprise Value | -124 | |||||||||
| Net Debt | 120 | |||||||||
| Equity Value | -245 | |||||||||
| Diluted Shares Outstanding, MM | 362 | |||||||||
| Equity Value Per Share | -0.68 |
What You Will Receive
- Customizable Excel Template: A user-friendly Excel-based DCF Calculator featuring pre-populated financial data for Fujian Yuanli Active Carbon Co., Ltd. (300174SZ).
- Accurate Market Data: Comprehensive historical data and forward-looking projections (highlighted in the yellow cells).
- Adjustable Forecasts: Modify forecast parameters such as revenue growth, EBITDA %, and WACC with ease.
- Instant Calculations: Quickly observe how your inputs affect the valuation of Fujian Yuanli Active Carbon Co., Ltd. (300174SZ).
- Professional Resource: Designed for investors, CFOs, consultants, and financial analysts.
- Intuitive Layout: Organized for simplicity and efficiency, complete with step-by-step guidance.
Key Features
- 🔍 Real-Life (300174SZ) Financials: Pre-filled historical and projected data for Fujian Yuanli Active Carbon Co., Ltd.
- ✏️ Fully Customizable Inputs: Modify all essential parameters (yellow cells) such as WACC, growth %, and tax rates.
- 📊 Professional DCF Valuation: Built-in formulas compute the intrinsic value of (300174SZ) using the Discounted Cash Flow method.
- ⚡ Instant Results: Visualize the valuation of (300174SZ) immediately after making adjustments.
- Scenario Analysis: Evaluate and compare outcomes for different financial assumptions side-by-side.
How It Functions
- 1. Access the Template: Download and open the Excel file containing Fujian Yuanli Active Carbon Co., Ltd.'s preloaded data.
- 2. Adjust Parameters: Modify essential inputs such as growth rates, WACC, and capital expenditures.
- 3. See Results in Real-Time: The DCF model automatically computes intrinsic value and NPV.
- 4. Explore Scenarios: Evaluate various forecasts to investigate different valuation results.
- 5. Utilize with Assurance: Present expert valuation findings to strengthen your decision-making process.
Why Opt for Fujian Yuanli Active Carbon Co., Ltd. Calculator?
- Precision: Utilizes authentic financial data for unparalleled accuracy.
- Versatility: Built for users to experiment and adjust inputs with ease.
- Efficiency: Eliminate the complexities of creating a DCF model from the ground up.
- Expert-Level: Crafted with the insight and usability expected by CFOs.
- Intuitive: Simple to navigate, making it accessible for those new to financial modeling.
Who Can Benefit from This Product?
- Investors: Accurately assess the fair value of Fujian Yuanli Active Carbon Co.,Ltd. (300174SZ) prior to making investment choices.
- CFOs: Utilize a sophisticated DCF model for robust financial reporting and analysis.
- Consultants: Efficiently customize the template for client valuation reports.
- Entrepreneurs: Discover financial modeling techniques employed by leading companies.
- Educators: Implement it as a resource to teach valuation methodologies effectively.
Contents of the Template
- Preloaded FJYC Data: Historical and projected financial information, including revenue, EBIT, and capital expenditures.
- DCF and WACC Models: Sophisticated spreadsheets for determining intrinsic value and Weighted Average Cost of Capital.
- Editable Inputs: Yellow-highlighted cells designed for modifying revenue growth, tax rates, and discount rates.
- Financial Statements: Detailed annual and quarterly financial reports for in-depth analysis.
- Key Ratios: Profitability, leverage, and efficiency metrics for performance assessment.
- Dashboard and Charts: Visual representations of valuation results and assumptions.
Disclaimer
All information, articles, and product details provided on this website are for general informational and educational purposes only. We do not claim any ownership over, nor do we intend to infringe upon, any trademarks, copyrights, logos, brand names, or other intellectual property mentioned or depicted on this site. Such intellectual property remains the property of its respective owners, and any references here are made solely for identification or informational purposes, without implying any affiliation, endorsement, or partnership.
We make no representations or warranties, express or implied, regarding the accuracy, completeness, or suitability of any content or products presented. Nothing on this website should be construed as legal, tax, investment, financial, medical, or other professional advice. In addition, no part of this site—including articles or product references—constitutes a solicitation, recommendation, endorsement, advertisement, or offer to buy or sell any securities, franchises, or other financial instruments, particularly in jurisdictions where such activity would be unlawful.
All content is of a general nature and may not address the specific circumstances of any individual or entity. It is not a substitute for professional advice or services. Any actions you take based on the information provided here are strictly at your own risk. You accept full responsibility for any decisions or outcomes arising from your use of this website and agree to release us from any liability in connection with your use of, or reliance upon, the content or products found herein.