
|
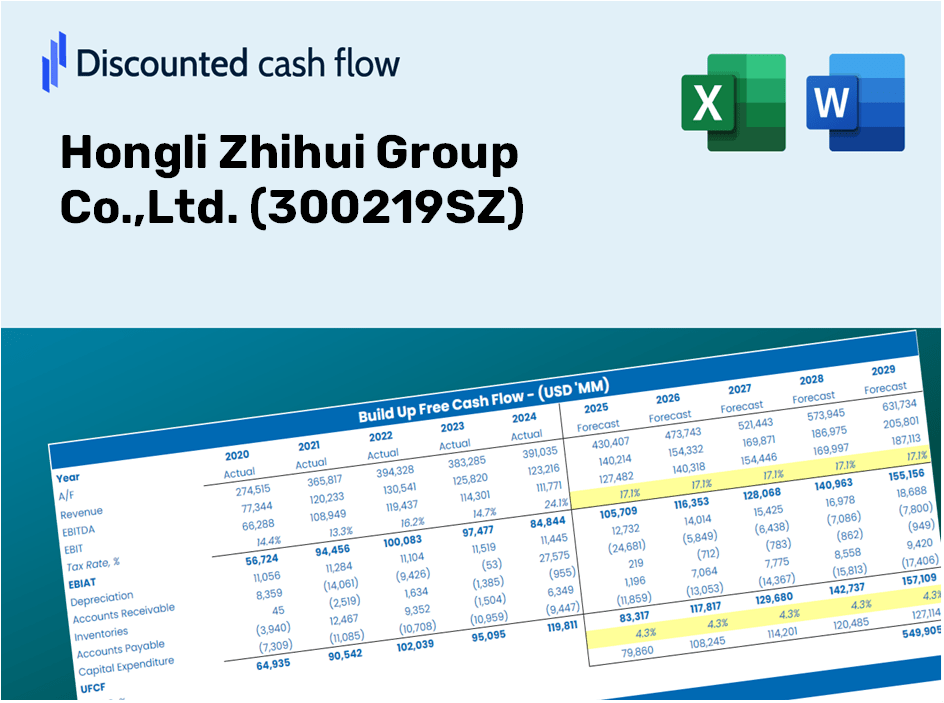
Hongli Zhihui Group Co., Ltd. (300219.SZ) Évaluation DCF |
Entièrement Modifiable: Adapté À Vos Besoins Dans Excel Ou Sheets
Conception Professionnelle: Modèles Fiables Et Conformes Aux Normes Du Secteur
Pré-Construits Pour Une Utilisation Rapide Et Efficace
Compatible MAC/PC, entièrement débloqué
Aucune Expertise N'Est Requise; Facile À Suivre
Hongli Zhihui Group Co.,Ltd. (300219.SZ) Bundle
Que vous soyez un investisseur ou un analyste, cette calculatrice DCF (300219SZ) est votre ressource incontournable pour une évaluation précise. Préchargé avec Hongli Zhihui Group Co., Ltd. Données réelles, vous pouvez ajuster les prévisions et observer les effets en temps réel.
Discounted Cash Flow (DCF) - (USD MM)
| Year | AY1 2020 |
AY2 2021 |
AY3 2022 |
AY4 2023 |
AY5 2024 |
FY1 2025 |
FY2 2026 |
FY3 2027 |
FY4 2028 |
FY5 2029 |
|---|---|---|---|---|---|---|---|---|---|---|
| Revenue | 3,124.3 | 4,075.2 | 3,636.4 | 3,759.4 | 4,225.1 | 4,599.4 | 5,006.9 | 5,450.5 | 5,933.3 | 6,459.0 |
| Revenue Growth, % | 0 | 30.43 | -10.77 | 3.38 | 12.39 | 8.86 | 8.86 | 8.86 | 8.86 | 8.86 |
| EBITDA | 292.5 | 461.0 | 397.8 | 494.4 | 315.3 | 480.4 | 523.0 | 569.3 | 619.7 | 674.7 |
| EBITDA, % | 9.36 | 11.31 | 10.94 | 13.15 | 7.46 | 10.45 | 10.45 | 10.45 | 10.45 | 10.45 |
| Depreciation | 215.6 | 223.2 | 198.6 | 213.3 | 197.2 | 259.2 | 282.2 | 307.2 | 334.4 | 364.1 |
| Depreciation, % | 6.9 | 5.48 | 5.46 | 5.67 | 4.67 | 5.64 | 5.64 | 5.64 | 5.64 | 5.64 |
| EBIT | 76.8 | 237.8 | 199.2 | 281.1 | 118.1 | 221.2 | 240.8 | 262.1 | 285.3 | 310.6 |
| EBIT, % | 2.46 | 5.83 | 5.48 | 7.48 | 2.79 | 4.81 | 4.81 | 4.81 | 4.81 | 4.81 |
| Total Cash | 221.1 | 402.3 | 548.6 | 778.0 | 940.8 | 689.9 | 751.0 | 817.5 | 889.9 | 968.8 |
| Total Cash, percent | .0 | .0 | .0 | .0 | .0 | .0 | .0 | .0 | .0 | .0 |
| Account Receivables | 1,220.7 | 1,254.3 | 1,172.0 | 1,446.5 | 1,729.1 | 1,669.4 | 1,817.3 | 1,978.3 | 2,153.5 | 2,344.3 |
| Account Receivables, % | 39.07 | 30.78 | 32.23 | 38.48 | 40.92 | 36.3 | 36.3 | 36.3 | 36.3 | 36.3 |
| Inventories | 480.1 | 612.2 | 505.6 | 577.8 | 725.6 | 706.8 | 769.4 | 837.6 | 911.8 | 992.5 |
| Inventories, % | 15.37 | 15.02 | 13.9 | 15.37 | 17.17 | 15.37 | 15.37 | 15.37 | 15.37 | 15.37 |
| Accounts Payable | 1,116.4 | 1,324.0 | 1,060.3 | 1,401.4 | 2,099.0 | 1,695.7 | 1,845.9 | 2,009.4 | 2,187.5 | 2,381.2 |
| Accounts Payable, % | 35.73 | 32.49 | 29.16 | 37.28 | 49.68 | 36.87 | 36.87 | 36.87 | 36.87 | 36.87 |
| Capital Expenditure | -362.7 | -497.9 | -684.0 | -274.8 | -387.2 | -543.7 | -591.9 | -644.3 | -701.4 | -763.5 |
| Capital Expenditure, % | -11.61 | -12.22 | -18.81 | -7.31 | -9.16 | -11.82 | -11.82 | -11.82 | -11.82 | -11.82 |
| Tax Rate, % | 10.12 | 10.12 | 10.12 | 10.12 | 10.12 | 10.12 | 10.12 | 10.12 | 10.12 | 10.12 |
| EBITAT | 69.4 | 249.8 | 171.4 | 239.8 | 106.1 | 199.7 | 217.4 | 236.7 | 257.7 | 280.5 |
| Depreciation | ||||||||||
| Changes in Account Receivables | ||||||||||
| Changes in Inventories | ||||||||||
| Changes in Accounts Payable | ||||||||||
| Capital Expenditure | ||||||||||
| UFCF | -661.9 | 17.0 | -388.8 | 172.7 | 183.4 | -409.6 | -152.5 | -166.0 | -180.7 | -196.8 |
| WACC, % | 6.14 | 6.2 | 6.11 | 6.11 | 6.13 | 6.14 | 6.14 | 6.14 | 6.14 | 6.14 |
| PV UFCF | ||||||||||
| SUM PV UFCF | -948.7 | |||||||||
| Long Term Growth Rate, % | 3.50 | |||||||||
| Free cash flow (T + 1) | -204 | |||||||||
| Terminal Value | -7,722 | |||||||||
| Present Terminal Value | -5,733 | |||||||||
| Enterprise Value | -6,682 | |||||||||
| Net Debt | -302 | |||||||||
| Equity Value | -6,380 | |||||||||
| Diluted Shares Outstanding, MM | 740 | |||||||||
| Equity Value Per Share | -8.63 |
What You Will Receive
- Authentic 300219SZ Financial Data: Pre-loaded with Hongli Zhihui Group Co., Ltd.'s historical and anticipated figures for accurate assessments.
- Completely Customizable Template: Easily adjust key metrics such as revenue growth, WACC, and EBITDA percentages.
- Instant Calculations: Witness real-time updates of Hongli Zhihui's intrinsic value as you make modifications.
- Expert Valuation Tool: Tailored for investors, analysts, and consultants aiming for reliable DCF outcomes.
- Intuitive Interface: Clear layout and straightforward instructions suitable for all skill levels.
Key Features
- Comprehensive DCF Calculator: Offers in-depth unlevered and levered Discounted Cash Flow valuation models tailored for Hongli Zhihui Group Co., Ltd. (300219SZ).
- WACC Calculator: Features a pre-designed Weighted Average Cost of Capital sheet with adjustable input parameters.
- Customizable Forecast Assumptions: Allows modifications of growth projections, capital expenditures, and discount rates specific to the company.
- Integrated Financial Ratios: Evaluate profitability, leverage, and efficiency ratios for Hongli Zhihui Group Co., Ltd. (300219SZ).
- Visual Dashboard and Charts: Provides graphical representations to summarize key valuation metrics for streamlined analysis.
How It Works
- Step 1: Download the Excel spreadsheet.
- Step 2: Examine the pre-populated data for Hongli Zhihui Group Co., Ltd. (300219SZ).
- Step 3: Modify the key assumptions (highlighted in yellow) according to your insights.
- Step 4: Observe the automatic updates that reflect Hongli Zhihui's intrinsic value.
- Step 5: Utilize the results for investment decisions or reporting purposes.
Why Choose This Calculator for Hongli Zhihui Group Co.,Ltd. (300219SZ)?
- All-in-One Solution: Combines DCF, WACC, and financial ratio analyses for comprehensive evaluations.
- Flexible Inputs: Modify the highlighted fields to explore different financial scenarios.
- Insightful Analysis: Automatically computes the intrinsic value and Net Present Value for Hongli Zhihui Group.
- Preloaded Information: Comes with historical and projected data for precise calculations.
- High-Quality Standards: Perfect for financial analysts, investors, and business consultants focusing on (300219SZ).
Who Can Benefit from This Product?
- Investors: Evaluate the valuation of Hongli Zhihui Group Co., Ltd. (300219SZ) before making investment decisions.
- CFOs and Financial Analysts: Optimize valuation methodologies and assess financial forecasts.
- Startup Founders: Gain insights into how established companies like Hongli Zhihui Group Co., Ltd. (300219SZ) are appraised.
- Consultants: Provide comprehensive valuation reports tailored for clients.
- Students and Educators: Utilize authentic data to learn and instruct on valuation practices.
Contents of the Template
- Historical Data: Comprises Hongli Zhihui Group Co., Ltd.'s past financial performance and foundational forecasts.
- DCF and Levered DCF Models: Comprehensive models to assess the intrinsic value of Hongli Zhihui Group Co.,Ltd. (300219SZ).
- WACC Sheet: Pre-calculated metrics for the Weighted Average Cost of Capital.
- Editable Inputs: Adjust key parameters such as growth projections, EBITDA percentage, and CAPEX estimates.
- Quarterly and Annual Statements: An in-depth overview of Hongli Zhihui Group Co.,Ltd.'s (300219SZ) financials.
- Interactive Dashboard: Dynamically visualize valuation results and future forecasts.
Disclaimer
All information, articles, and product details provided on this website are for general informational and educational purposes only. We do not claim any ownership over, nor do we intend to infringe upon, any trademarks, copyrights, logos, brand names, or other intellectual property mentioned or depicted on this site. Such intellectual property remains the property of its respective owners, and any references here are made solely for identification or informational purposes, without implying any affiliation, endorsement, or partnership.
We make no representations or warranties, express or implied, regarding the accuracy, completeness, or suitability of any content or products presented. Nothing on this website should be construed as legal, tax, investment, financial, medical, or other professional advice. In addition, no part of this site—including articles or product references—constitutes a solicitation, recommendation, endorsement, advertisement, or offer to buy or sell any securities, franchises, or other financial instruments, particularly in jurisdictions where such activity would be unlawful.
All content is of a general nature and may not address the specific circumstances of any individual or entity. It is not a substitute for professional advice or services. Any actions you take based on the information provided here are strictly at your own risk. You accept full responsibility for any decisions or outcomes arising from your use of this website and agree to release us from any liability in connection with your use of, or reliance upon, the content or products found herein.