
|
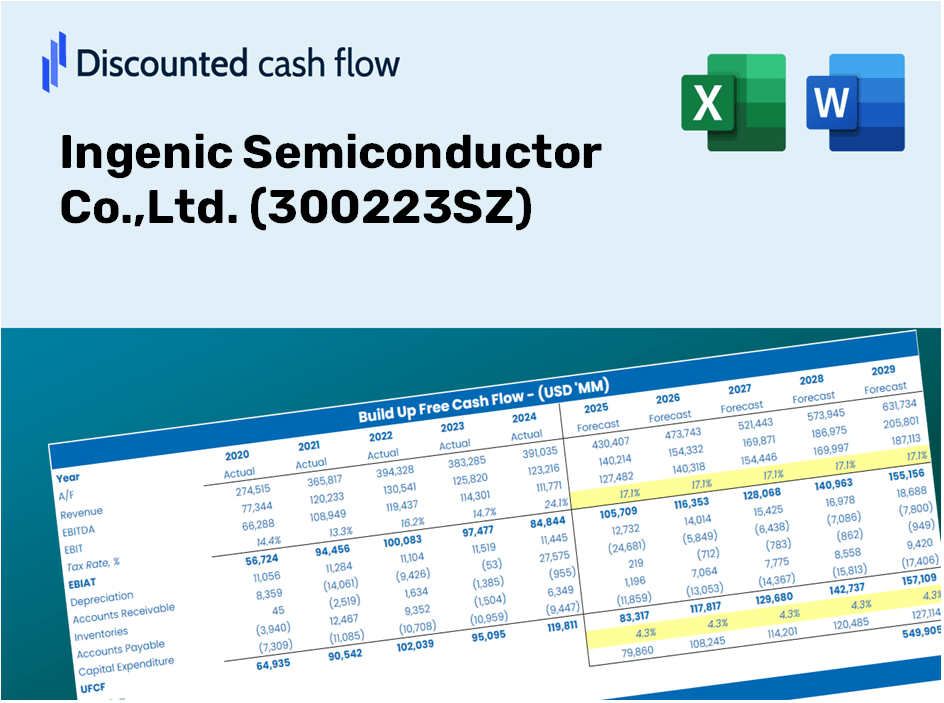
Ingenic Semiconductor Co., Ltd. (300223.SZ) Évaluation DCF |
Entièrement Modifiable: Adapté À Vos Besoins Dans Excel Ou Sheets
Conception Professionnelle: Modèles Fiables Et Conformes Aux Normes Du Secteur
Pré-Construits Pour Une Utilisation Rapide Et Efficace
Compatible MAC/PC, entièrement débloqué
Aucune Expertise N'Est Requise; Facile À Suivre
Ingenic Semiconductor Co.,Ltd. (300223.SZ) Bundle
Découvrez le véritable potentiel d'Ingenic Semiconductor Co., Ltd. avec notre calculatrice DCF de qualité professionnelle! Ajustez les hypothèses clés, explorez divers scénarios et évaluez comment les changements affectent l'évaluation de la semi-conducteur ingénique - le tout dans un seul modèle Excel.
Discounted Cash Flow (DCF) - (USD MM)
| Year | AY1 2020 |
AY2 2021 |
AY3 2022 |
AY4 2023 |
AY5 2024 |
FY1 2025 |
FY2 2026 |
FY3 2027 |
FY4 2028 |
FY5 2029 |
|---|---|---|---|---|---|---|---|---|---|---|
| Revenue | 2,169.8 | 5,274.1 | 5,411.9 | 4,530.9 | 4,212.6 | 4,379.7 | 4,553.5 | 4,734.1 | 4,921.9 | 5,117.2 |
| Revenue Growth, % | 0 | 143.07 | 2.61 | -16.28 | -7.03 | 3.97 | 3.97 | 3.97 | 3.97 | 3.97 |
| EBITDA | 128.3 | 1,121.3 | 943.4 | 620.5 | 446.7 | 603.6 | 627.5 | 652.4 | 678.3 | 705.2 |
| EBITDA, % | 5.91 | 21.26 | 17.43 | 13.69 | 10.6 | 13.78 | 13.78 | 13.78 | 13.78 | 13.78 |
| Depreciation | 133.0 | 225.1 | 240.6 | 218.5 | 171.0 | 207.8 | 216.1 | 224.6 | 233.5 | 242.8 |
| Depreciation, % | 6.13 | 4.27 | 4.45 | 4.82 | 4.06 | 4.74 | 4.74 | 4.74 | 4.74 | 4.74 |
| EBIT | -4.7 | 896.2 | 702.8 | 402.0 | 275.7 | 395.8 | 411.5 | 427.8 | 444.8 | 462.4 |
| EBIT, % | -0.21606 | 16.99 | 12.99 | 8.87 | 6.55 | 9.04 | 9.04 | 9.04 | 9.04 | 9.04 |
| Total Cash | 1,862.0 | 3,880.7 | 3,751.4 | 4,321.1 | 4,474.4 | 3,714.8 | 3,862.1 | 4,015.3 | 4,174.6 | 4,340.2 |
| Total Cash, percent | .0 | .0 | .0 | .0 | .0 | .0 | .0 | .0 | .0 | .0 |
| Account Receivables | 463.6 | 755.1 | 622.3 | 691.4 | 675.8 | 687.5 | 714.7 | 743.1 | 772.6 | 803.2 |
| Account Receivables, % | 21.36 | 14.32 | 11.5 | 15.26 | 16.04 | 15.7 | 15.7 | 15.7 | 15.7 | 15.7 |
| Inventories | 1,305.3 | 1,419.4 | 2,303.8 | 2,404.8 | 2,672.0 | 2,156.1 | 2,241.6 | 2,330.5 | 2,423.0 | 2,519.1 |
| Inventories, % | 60.16 | 26.91 | 42.57 | 53.07 | 63.43 | 49.23 | 49.23 | 49.23 | 49.23 | 49.23 |
| Accounts Payable | 372.8 | 658.7 | 659.8 | 422.6 | 433.7 | 538.6 | 559.9 | 582.2 | 605.3 | 629.3 |
| Accounts Payable, % | 17.18 | 12.49 | 12.19 | 9.33 | 10.3 | 12.3 | 12.3 | 12.3 | 12.3 | 12.3 |
| Capital Expenditure | -85.8 | -222.7 | -139.3 | -104.0 | -113.1 | -137.8 | -143.3 | -149.0 | -154.9 | -161.0 |
| Capital Expenditure, % | -3.95 | -4.22 | -2.57 | -2.3 | -2.68 | -3.15 | -3.15 | -3.15 | -3.15 | -3.15 |
| Tax Rate, % | 10.67 | 10.67 | 10.67 | 10.67 | 10.67 | 10.67 | 10.67 | 10.67 | 10.67 | 10.67 |
| EBITAT | -4.8 | 888.7 | 680.6 | 396.2 | 246.3 | 383.0 | 398.2 | 414.0 | 430.4 | 447.5 |
| Depreciation | ||||||||||
| Changes in Account Receivables | ||||||||||
| Changes in Inventories | ||||||||||
| Changes in Accounts Payable | ||||||||||
| Capital Expenditure | ||||||||||
| UFCF | -1,353.6 | 771.2 | 31.4 | 103.4 | 63.7 | 1,062.1 | 379.5 | 394.6 | 410.2 | 426.5 |
| WACC, % | 6.55 | 6.55 | 6.55 | 6.55 | 6.55 | 6.55 | 6.55 | 6.55 | 6.55 | 6.55 |
| PV UFCF | ||||||||||
| SUM PV UFCF | 2,286.1 | |||||||||
| Long Term Growth Rate, % | 3.50 | |||||||||
| Free cash flow (T + 1) | 441 | |||||||||
| Terminal Value | 14,474 | |||||||||
| Present Terminal Value | 10,540 | |||||||||
| Enterprise Value | 12,826 | |||||||||
| Net Debt | -3,703 | |||||||||
| Equity Value | 16,529 | |||||||||
| Diluted Shares Outstanding, MM | 482 | |||||||||
| Equity Value Per Share | 34.27 |
What You Will Receive
- Genuine Ingenic Data: Comprehensive financials – encompassing everything from revenue to EBIT – derived from actual and forecasted figures.
- Complete Customization: Modify all essential parameters (yellow cells) such as WACC, growth %, and tax rates to fit your analysis.
- Instant Valuation Refreshes: Automatic updates that allow you to assess how changes affect Ingenic's fair value.
- Flexible Excel Template: Designed for quick modifications, scenario analysis, and in-depth projections.
- Efficient and Precise: Bypass the need to create models from the ground up while ensuring accuracy and adaptability.
Key Features
- Comprehensive DCF Calculator: Features in-depth unlevered and levered DCF valuation models tailored for Ingenic Semiconductor Co., Ltd. (300223SZ).
- WACC Calculator: Comes with a pre-configured Weighted Average Cost of Capital sheet that allows for customizable inputs.
- Customizable Forecast Assumptions: Adjust growth rates, capital expenditures, and discount rates as needed.
- Integrated Financial Ratios: Evaluate profitability, leverage, and efficiency ratios specifically for Ingenic Semiconductor Co., Ltd. (300223SZ).
- Visual Dashboard and Charts: Generate visual summaries of key valuation metrics for straightforward analysis.
How It Functions
- Download: Get the pre-configured Excel file containing Ingenic Semiconductor Co., Ltd.'s (300223SZ) financial data.
- Customize: Modify projections such as revenue growth, EBITDA %, and WACC to suit your analysis.
- Real-Time Updates: Watch as intrinsic value and NPV calculations refresh automatically.
- Scenario Testing: Generate various projections and compare results effortlessly.
- Informed Decisions: Leverage the valuation findings to shape your investment approach.
Why Choose Ingenic Semiconductor's Calculator?
- Save Time: Eliminate the hassle of building a DCF model from the ground up – it's ready for immediate use.
- Enhance Accuracy: Dependable financial data and formulas minimize valuation errors.
- Fully Customizable: Adjust the model to align with your specific assumptions and projections.
- Easy to Interpret: Intuitive charts and outputs facilitate straightforward analysis of results.
- Preferred by Professionals: Designed with the needs of experts in mind, prioritizing precision and user-friendliness.
Who Can Benefit from This Product?
- Finance Students: Explore valuation techniques and apply them to real-world data, specifically for Ingenic Semiconductor Co., Ltd. (300223SZ).
- Researchers: Utilize professional valuation models in your academic studies or research, focusing on Ingenic Semiconductor Co., Ltd. (300223SZ).
- Investors: Validate your investment assumptions and analyze valuation outcomes for Ingenic Semiconductor Co., Ltd. (300223SZ).
- Market Analysts: Enhance your analysis workflow with a ready-to-use, customizable DCF model tailored for Ingenic Semiconductor Co., Ltd. (300223SZ).
- Entrepreneurs: Discover how large public firms, such as Ingenic Semiconductor Co., Ltd. (300223SZ), are evaluated in the market.
Contents of the Template
- Operating and Balance Sheet Data: Pre-filled historical data and forecasts for Ingenic Semiconductor Co., Ltd. (300223SZ), including revenue, EBITDA, EBIT, and capital expenditures.
- WACC Calculation: A dedicated sheet for calculating Weighted Average Cost of Capital (WACC), featuring parameters such as Beta, risk-free rate, and current share price.
- DCF Valuation (Unlevered and Levered): Customizable Discounted Cash Flow models that present intrinsic value with comprehensive calculations.
- Financial Statements: Pre-loaded annual and quarterly financial statements to facilitate detailed analysis.
- Key Ratios: A collection of profitability, leverage, and efficiency ratios specific to Ingenic Semiconductor Co., Ltd. (300223SZ).
- Dashboard and Charts: Visual representation of valuation results and assumptions for easy analysis of outcomes.
Disclaimer
All information, articles, and product details provided on this website are for general informational and educational purposes only. We do not claim any ownership over, nor do we intend to infringe upon, any trademarks, copyrights, logos, brand names, or other intellectual property mentioned or depicted on this site. Such intellectual property remains the property of its respective owners, and any references here are made solely for identification or informational purposes, without implying any affiliation, endorsement, or partnership.
We make no representations or warranties, express or implied, regarding the accuracy, completeness, or suitability of any content or products presented. Nothing on this website should be construed as legal, tax, investment, financial, medical, or other professional advice. In addition, no part of this site—including articles or product references—constitutes a solicitation, recommendation, endorsement, advertisement, or offer to buy or sell any securities, franchises, or other financial instruments, particularly in jurisdictions where such activity would be unlawful.
All content is of a general nature and may not address the specific circumstances of any individual or entity. It is not a substitute for professional advice or services. Any actions you take based on the information provided here are strictly at your own risk. You accept full responsibility for any decisions or outcomes arising from your use of this website and agree to release us from any liability in connection with your use of, or reliance upon, the content or products found herein.