
|
Shanghai Sinyang Semiconductor Materials Co., Ltd. (300236.SZ) Valation DCF |
Entièrement Modifiable: Adapté À Vos Besoins Dans Excel Ou Sheets
Conception Professionnelle: Modèles Fiables Et Conformes Aux Normes Du Secteur
Pré-Construits Pour Une Utilisation Rapide Et Efficace
Compatible MAC/PC, entièrement débloqué
Aucune Expertise N'Est Requise; Facile À Suivre
Shanghai Sinyang Semiconductor Materials Co., Ltd. (300236.SZ) Bundle
Conçu pour la précision, notre calculatrice DCF (300236SZ) vous permet d'évaluer l'évaluation de Shanghai Sinyang Semiconductor Materials Co., Ltd. avec des données financières en temps réel et une flexibilité complète pour modifier tous les paramètres essentiels pour des projections améliorées.
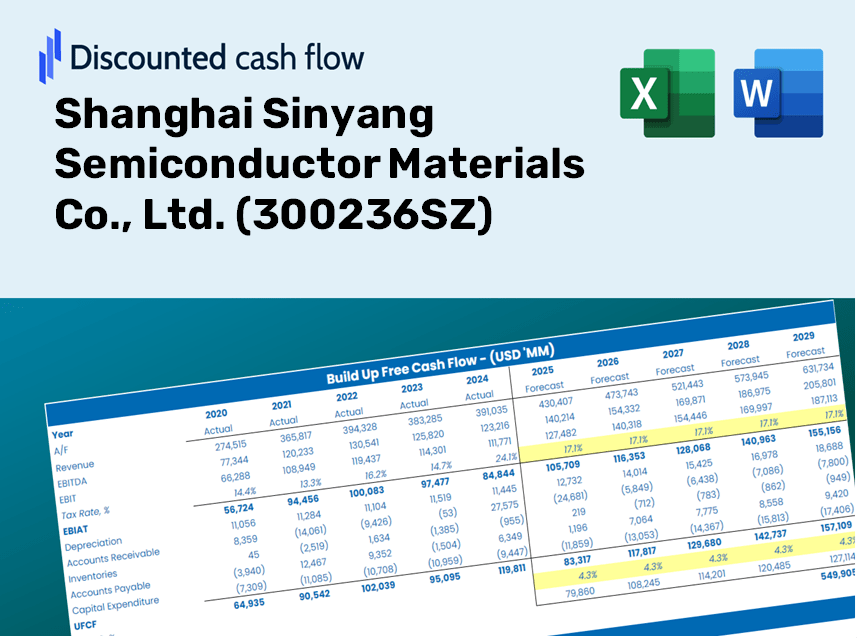
Discounted Cash Flow (DCF) - (USD MM)
| Year | AY1 2020 |
AY2 2021 |
AY3 2022 |
AY4 2023 |
AY5 2024 |
FY1 2025 |
FY2 2026 |
FY3 2027 |
FY4 2028 |
FY5 2029 |
|---|---|---|---|---|---|---|---|---|---|---|
| Revenue | 693.9 | 1,016.4 | 1,195.7 | 1,212.4 | 1,475.2 | 1,796.7 | 2,188.4 | 2,665.4 | 3,246.4 | 3,954.0 |
| Revenue Growth, % | 0 | 46.47 | 17.64 | 1.4 | 21.67 | 21.8 | 21.8 | 21.8 | 21.8 | 21.8 |
| EBITDA | 74.6 | 48.1 | 162.2 | 191.8 | 252.6 | 222.7 | 271.3 | 330.4 | 402.5 | 490.2 |
| EBITDA, % | 10.74 | 4.73 | 13.57 | 15.82 | 17.13 | 12.4 | 12.4 | 12.4 | 12.4 | 12.4 |
| Depreciation | 27.6 | 44.4 | 53.7 | 70.6 | 85.2 | 87.8 | 106.9 | 130.3 | 158.7 | 193.2 |
| Depreciation, % | 3.98 | 4.37 | 4.49 | 5.82 | 5.78 | 4.89 | 4.89 | 4.89 | 4.89 | 4.89 |
| EBIT | 46.9 | 3.7 | 108.6 | 121.2 | 167.5 | 134.9 | 164.4 | 200.2 | 243.8 | 297.0 |
| EBIT, % | 6.76 | 0.36285 | 9.08 | 10 | 11.35 | 7.51 | 7.51 | 7.51 | 7.51 | 7.51 |
| Total Cash | 247.8 | 1,475.0 | 1,140.8 | 915.7 | 709.1 | 1,274.7 | 1,552.5 | 1,890.9 | 2,303.1 | 2,805.1 |
| Total Cash, percent | .0 | .0 | .0 | .0 | .0 | .0 | .0 | .0 | .0 | .0 |
| Account Receivables | 522.1 | 504.9 | 648.7 | 734.4 | 829.0 | 1,063.5 | 1,295.3 | 1,577.6 | 1,921.5 | 2,340.4 |
| Account Receivables, % | 75.25 | 49.67 | 54.25 | 60.57 | 56.2 | 59.19 | 59.19 | 59.19 | 59.19 | 59.19 |
| Inventories | 136.8 | 273.0 | 299.3 | 274.7 | 326.5 | 418.2 | 509.4 | 620.4 | 755.7 | 920.4 |
| Inventories, % | 19.71 | 26.86 | 25.03 | 22.66 | 22.13 | 23.28 | 23.28 | 23.28 | 23.28 | 23.28 |
| Accounts Payable | 237.5 | 433.9 | 339.1 | 194.8 | 507.1 | 559.6 | 681.5 | 830.1 | 1,011.0 | 1,231.4 |
| Accounts Payable, % | 34.22 | 42.69 | 28.36 | 16.07 | 34.38 | 31.14 | 31.14 | 31.14 | 31.14 | 31.14 |
| Capital Expenditure | -170.5 | -408.8 | -200.9 | -213.2 | -209.5 | -407.4 | -496.2 | -604.4 | -736.1 | -896.6 |
| Capital Expenditure, % | -24.57 | -40.23 | -16.8 | -17.58 | -14.2 | -22.68 | -22.68 | -22.68 | -22.68 | -22.68 |
| Tax Rate, % | 8.5 | 8.5 | 8.5 | 8.5 | 8.5 | 8.5 | 8.5 | 8.5 | 8.5 | 8.5 |
| EBITAT | 38.8 | 3.5 | 111.1 | 108.4 | 153.2 | 123.8 | 150.8 | 183.6 | 223.6 | 272.4 |
| Depreciation | ||||||||||
| Changes in Account Receivables | ||||||||||
| Changes in Inventories | ||||||||||
| Changes in Accounts Payable | ||||||||||
| Capital Expenditure | ||||||||||
| UFCF | -525.5 | -283.5 | -301.0 | -239.6 | 194.8 | -469.6 | -439.5 | -535.3 | -652.0 | -794.2 |
| WACC, % | 9.11 | 9.12 | 9.13 | 9.12 | 9.12 | 9.12 | 9.12 | 9.12 | 9.12 | 9.12 |
| PV UFCF | ||||||||||
| SUM PV UFCF | -2,184.7 | |||||||||
| Long Term Growth Rate, % | 4.00 | |||||||||
| Free cash flow (T + 1) | -826 | |||||||||
| Terminal Value | -16,131 | |||||||||
| Present Terminal Value | -10,427 | |||||||||
| Enterprise Value | -12,611 | |||||||||
| Net Debt | -383 | |||||||||
| Equity Value | -12,228 | |||||||||
| Diluted Shares Outstanding, MM | 310 | |||||||||
| Equity Value Per Share | -39.45 |
Benefits You Will Receive
- Comprehensive Financial Model: Utilize Shanghai Sinyang Semiconductor Materials Co., Ltd.'s (300236SZ) actual data for accurate DCF valuation.
- Complete Forecast Customization: Modify revenue growth, profit margins, WACC, and other essential parameters to suit your analysis.
- Real-Time Calculations: Enjoy automatic updates that provide immediate results as you adjust your inputs.
- Professional Template: Access a polished Excel file crafted for high-level valuation purposes.
- Flexible and Reusable: Designed with versatility in mind, this model allows for repeated use in comprehensive forecasting.
Key Features
- Pre-Loaded Data: Historical financial statements and pre-filled forecasts for Shanghai Sinyang Semiconductor Materials Co., Ltd. (300236SZ).
- Fully Adjustable Inputs: Customize WACC, tax rates, revenue growth, and EBITDA margins as needed.
- Instant Results: Watch the intrinsic value of Shanghai Sinyang Semiconductor Materials Co., Ltd. (300236SZ) update in real time.
- Clear Visual Outputs: Dashboard charts present valuation results and essential metrics.
- Built for Accuracy: A reliable tool designed for analysts, investors, and finance professionals.
How It Works
- Step 1: Download the Excel file.
- Step 2: Examine Shanghai Sinyang Semiconductor Materials Co., Ltd.'s pre-filled financial data and projections.
- Step 3: Adjust key inputs such as revenue growth, WACC, and tax rates (highlighted cells).
- Step 4: Observe the DCF model refresh in real-time as you modify your assumptions.
- Step 5: Evaluate the results and apply the insights for your investment strategies.
Why Opt for This Calculator?
- Tailored for Experts: An advanced tool designed for analysts, CFOs, and consultants in the semiconductor industry.
- Accurate Data: Historical and projected financials of Shanghai Sinyang Semiconductor Materials Co., Ltd. included for precision.
- Scenario Analysis: Effortlessly model various forecasts and assumptions.
- Transparent Results: Instantly computes intrinsic value, NPV, and essential financial metrics.
- User-Friendly: Step-by-step guidance ensures a smooth experience.
Who Can Benefit from This Product?
- Investors: Evaluate the valuation of Shanghai Sinyang Semiconductor Materials Co., Ltd. (300236SZ) before making investment decisions.
- CFOs and Financial Analysts: Enhance valuation workflows and assess financial forecasts.
- Startup Founders: Understand how leading semiconductor companies like Shanghai Sinyang are appraised in the market.
- Consultants: Create detailed valuation reports for your clients focused on semiconductor materials.
- Students and Educators: Utilize real market data to learn and teach valuation methodologies.
Contents of the Template
- Pre-Filled DCF Model: Shanghai Sinyang Semiconductor's financial data preloaded for immediate analysis.
- WACC Calculator: Comprehensive calculations for Weighted Average Cost of Capital.
- Financial Ratios: Assess Shanghai Sinyang Semiconductor's profitability, leverage, and efficiency.
- Editable Inputs: Adjust assumptions like growth rates, margins, and CAPEX to fit your specific scenarios.
- Financial Statements: Access annual and quarterly reports for thorough analysis.
- Interactive Dashboard: Effortlessly visualize key valuation metrics and outcomes.
Disclaimer
All information, articles, and product details provided on this website are for general informational and educational purposes only. We do not claim any ownership over, nor do we intend to infringe upon, any trademarks, copyrights, logos, brand names, or other intellectual property mentioned or depicted on this site. Such intellectual property remains the property of its respective owners, and any references here are made solely for identification or informational purposes, without implying any affiliation, endorsement, or partnership.
We make no representations or warranties, express or implied, regarding the accuracy, completeness, or suitability of any content or products presented. Nothing on this website should be construed as legal, tax, investment, financial, medical, or other professional advice. In addition, no part of this site—including articles or product references—constitutes a solicitation, recommendation, endorsement, advertisement, or offer to buy or sell any securities, franchises, or other financial instruments, particularly in jurisdictions where such activity would be unlawful.
All content is of a general nature and may not address the specific circumstances of any individual or entity. It is not a substitute for professional advice or services. Any actions you take based on the information provided here are strictly at your own risk. You accept full responsibility for any decisions or outcomes arising from your use of this website and agree to release us from any liability in connection with your use of, or reliance upon, the content or products found herein.