
|
Shandong Sinocera Functional Material Co., Ltd. (300285.SZ) Évaluation DCF |
Entièrement Modifiable: Adapté À Vos Besoins Dans Excel Ou Sheets
Conception Professionnelle: Modèles Fiables Et Conformes Aux Normes Du Secteur
Pré-Construits Pour Une Utilisation Rapide Et Efficace
Compatible MAC/PC, entièrement débloqué
Aucune Expertise N'Est Requise; Facile À Suivre
Shandong Sinocera Functional Material Co., Ltd. (300285.SZ) Bundle
Évaluez Shandong Sinocera Functional Material Co., Ltd. Perspectives financières comme un expert! Cette calculatrice DCF (300285SZ) est livrée avec des données financières pré-remplies et vous offre un contrôle total pour modifier la croissance des revenus, le WACC, les marges et autres hypothèses essentielles pour s'aligner sur vos prévisions.
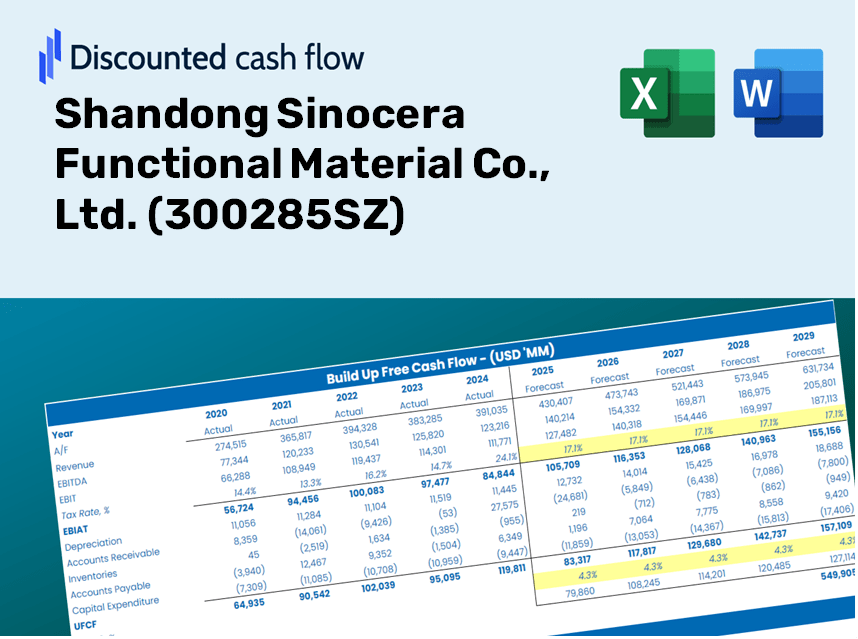
Discounted Cash Flow (DCF) - (USD MM)
| Year | AY1 2020 |
AY2 2021 |
AY3 2022 |
AY4 2023 |
AY5 2024 |
FY1 2025 |
FY2 2026 |
FY3 2027 |
FY4 2028 |
FY5 2029 |
|---|---|---|---|---|---|---|---|---|---|---|
| Revenue | 2,542.3 | 3,161.7 | 3,166.9 | 3,859.2 | 4,046.6 | 4,565.1 | 5,149.9 | 5,809.8 | 6,554.1 | 7,393.8 |
| Revenue Growth, % | 0 | 24.37 | 0.16288 | 21.86 | 4.86 | 12.81 | 12.81 | 12.81 | 12.81 | 12.81 |
| EBITDA | 865.7 | 1,081.0 | 673.3 | 915.9 | 1,037.3 | 1,267.9 | 1,430.3 | 1,613.6 | 1,820.3 | 2,053.6 |
| EBITDA, % | 34.05 | 34.19 | 21.26 | 23.73 | 25.63 | 27.77 | 27.77 | 27.77 | 27.77 | 27.77 |
| Depreciation | 125.5 | 142.6 | 170.2 | 234.0 | 308.5 | 260.3 | 293.6 | 331.2 | 373.7 | 421.6 |
| Depreciation, % | 4.94 | 4.51 | 5.37 | 6.06 | 7.62 | 5.7 | 5.7 | 5.7 | 5.7 | 5.7 |
| EBIT | 740.2 | 938.4 | 503.1 | 682.0 | 728.8 | 1,007.6 | 1,136.7 | 1,282.4 | 1,446.6 | 1,632.0 |
| EBIT, % | 29.11 | 29.68 | 15.89 | 17.67 | 18.01 | 22.07 | 22.07 | 22.07 | 22.07 | 22.07 |
| Total Cash | 1,319.9 | 2,009.3 | 566.2 | 744.4 | 652.1 | 1,540.7 | 1,738.1 | 1,960.8 | 2,212.0 | 2,495.4 |
| Total Cash, percent | .0 | .0 | .0 | .0 | .0 | .0 | .0 | .0 | .0 | .0 |
| Account Receivables | 1,193.3 | 1,565.2 | 1,690.6 | 2,096.8 | 2,165.7 | 2,352.6 | 2,654.1 | 2,994.1 | 3,377.7 | 3,810.4 |
| Account Receivables, % | 46.94 | 49.5 | 53.38 | 54.33 | 53.52 | 51.54 | 51.54 | 51.54 | 51.54 | 51.54 |
| Inventories | 493.4 | 705.6 | 890.8 | 789.5 | 857.9 | 1,018.1 | 1,148.5 | 1,295.7 | 1,461.7 | 1,648.9 |
| Inventories, % | 19.41 | 22.32 | 28.13 | 20.46 | 21.2 | 22.3 | 22.3 | 22.3 | 22.3 | 22.3 |
| Accounts Payable | 391.3 | 598.3 | 558.6 | 774.7 | 768.8 | 831.1 | 937.6 | 1,057.7 | 1,193.2 | 1,346.1 |
| Accounts Payable, % | 15.39 | 18.92 | 17.64 | 20.07 | 19 | 18.21 | 18.21 | 18.21 | 18.21 | 18.21 |
| Capital Expenditure | -218.4 | -541.0 | -545.5 | -440.8 | -376.2 | -581.1 | -655.5 | -739.5 | -834.3 | -941.1 |
| Capital Expenditure, % | -8.59 | -17.11 | -17.23 | -11.42 | -9.3 | -12.73 | -12.73 | -12.73 | -12.73 | -12.73 |
| Tax Rate, % | 20.55 | 20.55 | 20.55 | 20.55 | 20.55 | 20.55 | 20.55 | 20.55 | 20.55 | 20.55 |
| EBITAT | 593.7 | 779.6 | 444.9 | 550.8 | 579.0 | 830.1 | 936.5 | 1,056.5 | 1,191.8 | 1,344.5 |
| Depreciation | ||||||||||
| Changes in Account Receivables | ||||||||||
| Changes in Inventories | ||||||||||
| Changes in Accounts Payable | ||||||||||
| Capital Expenditure | ||||||||||
| UFCF | -794.5 | 4.1 | -280.8 | 255.1 | 368.1 | 224.6 | 249.2 | 281.1 | 317.2 | 357.8 |
| WACC, % | 8.67 | 8.67 | 8.68 | 8.67 | 8.67 | 8.67 | 8.67 | 8.67 | 8.67 | 8.67 |
| PV UFCF | ||||||||||
| SUM PV UFCF | 1,100.2 | |||||||||
| Long Term Growth Rate, % | 4.00 | |||||||||
| Free cash flow (T + 1) | 372 | |||||||||
| Terminal Value | 7,962 | |||||||||
| Present Terminal Value | 5,253 | |||||||||
| Enterprise Value | 6,353 | |||||||||
| Net Debt | -164 | |||||||||
| Equity Value | 6,517 | |||||||||
| Diluted Shares Outstanding, MM | 995 | |||||||||
| Equity Value Per Share | 6.55 |
What You Will Receive
- Authentic Sinocera Data: Preloaded financial information – covering everything from revenue to EBIT – sourced from actual and projected figures.
- Comprehensive Customization: Modify all essential parameters (yellow cells) such as WACC, growth %, and tax rates as needed.
- Instant Valuation Updates: Automatic recalculations to assess the effects of changes on Sinocera’s fair value.
- Flexible Excel Template: Designed for quick adjustments, scenario analysis, and in-depth projections.
- Time-Efficient and Precise: Eliminate the need to build models from scratch while ensuring accuracy and adaptability.
Key Features
- Comprehensive Historical Data: Access Shandong Sinocera's financial statements and expertly generated forecasts.
- Customizable Parameters: Modify WACC, tax rates, revenue growth, and EBITDA margins to suit your analysis.
- Real-Time Analysis: Observe the recalculation of Shandong Sinocera's intrinsic value as you make adjustments.
- Visual Analytics: Interactive dashboard displays valuation results and essential metrics with clarity.
- Precision Engineered: A professional-grade tool designed for analysts, investors, and finance professionals.
How It Works
- 1. Access the Template: Download and open the Excel file featuring Shandong Sinocera Functional Material Co., Ltd.'s preloaded data.
- 2. Update Key Assumptions: Modify essential inputs such as growth rates, WACC, and capital expenditures.
- 3. Instant Results: The DCF model will automatically compute intrinsic value and NPV as you update inputs.
- 4. Explore Scenarios: Evaluate multiple forecasts to assess various valuation possibilities.
- 5. Make Informed Decisions: Share professional valuation insights to enhance your strategic choices.
Why Choose Sinocera's Calculator?
- Precision: Leveraging authentic Shandong Sinocera financials for reliable data accuracy.
- Adaptability: Built for users to freely experiment with and adjust inputs.
- Efficiency: Eliminate the complexities of constructing a DCF model from the ground up.
- High-Quality Standards: Crafted with the rigor and usability expected at the CFO level.
- Intuitive Design: Simple to navigate, even for those lacking extensive financial modeling expertise.
Who Can Benefit from This Product?
- Material Science Students: Explore advanced materials and conduct hands-on experiments with real-world applications.
- Researchers: Utilize industry-standard models in your studies or projects related to functional materials.
- Investors: Validate your investment hypotheses and evaluate market trends for Shandong Sinocera Functional Material Co., Ltd. (300285SZ).
- Industry Analysts: Enhance your analysis with a customizable framework tailored for evaluating material companies.
- Entrepreneurs: Understand the methodologies used in assessing large-scale companies like Shandong Sinocera Functional Material Co., Ltd. (300285SZ).
Contents of the Template
- Preloaded Sinocera Data: Historical and projected financial figures, including revenue, EBIT, and capital expenditures.
- DCF and WACC Models: Professional-grade worksheets for calculating intrinsic value and Weighted Average Cost of Capital.
- Editable Inputs: Yellow-highlighted cells for modifying revenue growth, tax rates, and discount rates.
- Financial Statements: Detailed annual and quarterly financials for in-depth analysis.
- Key Ratios: Profitability, leverage, and efficiency ratios for performance evaluation.
- Dashboard and Charts: Visual representations of valuation results and underlying assumptions.
Disclaimer
All information, articles, and product details provided on this website are for general informational and educational purposes only. We do not claim any ownership over, nor do we intend to infringe upon, any trademarks, copyrights, logos, brand names, or other intellectual property mentioned or depicted on this site. Such intellectual property remains the property of its respective owners, and any references here are made solely for identification or informational purposes, without implying any affiliation, endorsement, or partnership.
We make no representations or warranties, express or implied, regarding the accuracy, completeness, or suitability of any content or products presented. Nothing on this website should be construed as legal, tax, investment, financial, medical, or other professional advice. In addition, no part of this site—including articles or product references—constitutes a solicitation, recommendation, endorsement, advertisement, or offer to buy or sell any securities, franchises, or other financial instruments, particularly in jurisdictions where such activity would be unlawful.
All content is of a general nature and may not address the specific circumstances of any individual or entity. It is not a substitute for professional advice or services. Any actions you take based on the information provided here are strictly at your own risk. You accept full responsibility for any decisions or outcomes arising from your use of this website and agree to release us from any liability in connection with your use of, or reliance upon, the content or products found herein.