
|
Informations Longmaster & Technology Co., Ltd. (300288.SZ) Évaluation DCF |
Entièrement Modifiable: Adapté À Vos Besoins Dans Excel Ou Sheets
Conception Professionnelle: Modèles Fiables Et Conformes Aux Normes Du Secteur
Pré-Construits Pour Une Utilisation Rapide Et Efficace
Compatible MAC/PC, entièrement débloqué
Aucune Expertise N'Est Requise; Facile À Suivre
Longmaster Information & Technology Co., Ltd. (300288.SZ) Bundle
Améliorez vos stratégies d'investissement avec les informations Longmaster & Technology Co., Ltd. (300288SZ) Calculatrice DCF! Utiliser des données financières authentiques, ajuster les prévisions et les dépenses de croissance et observer comment ces modifications affectent la valeur intrinsèque des informations de Longmaster & Technology Co., Ltd. (300288SZ) en temps réel.
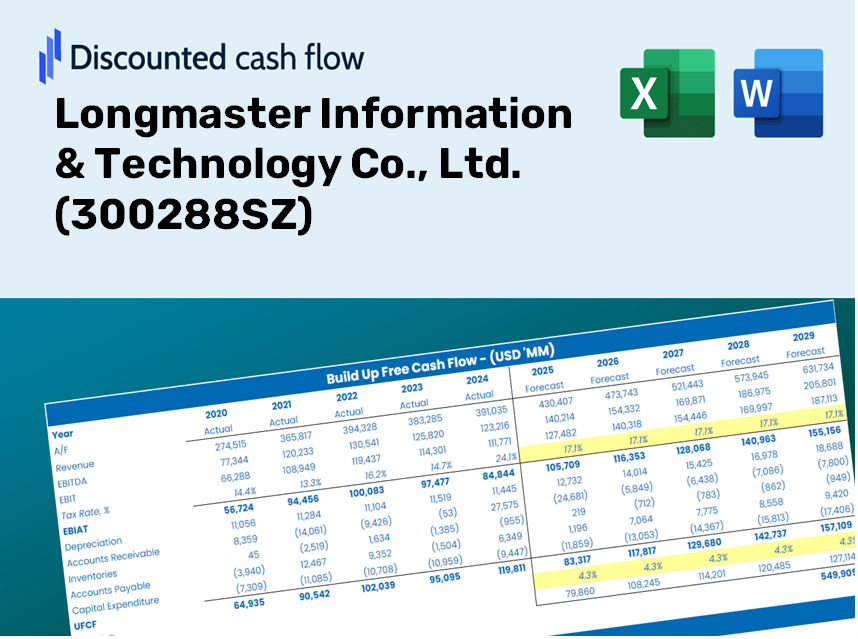
Discounted Cash Flow (DCF) - (USD MM)
| Year | AY1 2020 |
AY2 2021 |
AY3 2022 |
AY4 2023 |
AY5 2024 |
FY1 2025 |
FY2 2026 |
FY3 2027 |
FY4 2028 |
FY5 2029 |
|---|---|---|---|---|---|---|---|---|---|---|
| Revenue | 375.2 | 406.0 | 436.6 | 459.6 | 379.1 | 382.4 | 385.7 | 389.0 | 392.4 | 395.8 |
| Revenue Growth, % | 0 | 8.19 | 7.55 | 5.26 | -17.52 | 0.86983 | 0.86983 | 0.86983 | 0.86983 | 0.86983 |
| EBITDA | 62.2 | 79.5 | 108.9 | 108.1 | -478.7 | -11.8 | -11.9 | -12.0 | -12.1 | -12.2 |
| EBITDA, % | 16.58 | 19.57 | 24.95 | 23.52 | -126.27 | -3.08 | -3.08 | -3.08 | -3.08 | -3.08 |
| Depreciation | 19.0 | 21.5 | 26.1 | 23.6 | 26.0 | 21.7 | 21.9 | 22.0 | 22.2 | 22.4 |
| Depreciation, % | 5.05 | 5.3 | 5.97 | 5.14 | 6.86 | 5.67 | 5.67 | 5.67 | 5.67 | 5.67 |
| EBIT | 43.2 | 57.9 | 82.9 | 84.5 | -504.7 | -28.2 | -28.4 | -28.7 | -28.9 | -29.2 |
| EBIT, % | 11.52 | 14.27 | 18.98 | 18.38 | -133.13 | -7.37 | -7.37 | -7.37 | -7.37 | -7.37 |
| Total Cash | 419.9 | 382.2 | 332.8 | 302.4 | 283.5 | 314.3 | 317.0 | 319.8 | 322.5 | 325.4 |
| Total Cash, percent | .0 | .0 | .0 | .0 | .0 | .0 | .0 | .0 | .0 | .0 |
| Account Receivables | 60.3 | 50.2 | 70.5 | 65.4 | 80.5 | 61.2 | 61.7 | 62.3 | 62.8 | 63.3 |
| Account Receivables, % | 16.06 | 12.35 | 16.14 | 14.22 | 21.23 | 16 | 16 | 16 | 16 | 16 |
| Inventories | 8.4 | 6.9 | 7.8 | 9.0 | 9.3 | 7.7 | 7.8 | 7.9 | 7.9 | 8.0 |
| Inventories, % | 2.23 | 1.69 | 1.78 | 1.97 | 2.44 | 2.02 | 2.02 | 2.02 | 2.02 | 2.02 |
| Accounts Payable | 122.0 | 147.9 | 141.2 | 116.1 | 125.3 | 122.1 | 123.1 | 124.2 | 125.3 | 126.4 |
| Accounts Payable, % | 32.52 | 36.44 | 32.35 | 25.27 | 33.04 | 31.92 | 31.92 | 31.92 | 31.92 | 31.92 |
| Capital Expenditure | -2.2 | -15.8 | -8.5 | -94.2 | -15.1 | -23.6 | -23.8 | -24.1 | -24.3 | -24.5 |
| Capital Expenditure, % | -0.57435 | -3.89 | -1.96 | -20.49 | -3.99 | -6.18 | -6.18 | -6.18 | -6.18 | -6.18 |
| Tax Rate, % | -1.16 | -1.16 | -1.16 | -1.16 | -1.16 | -1.16 | -1.16 | -1.16 | -1.16 | -1.16 |
| EBITAT | 42.2 | 54.1 | 72.8 | 72.7 | -510.5 | -26.2 | -26.4 | -26.7 | -26.9 | -27.1 |
| Depreciation | ||||||||||
| Changes in Account Receivables | ||||||||||
| Changes in Inventories | ||||||||||
| Changes in Accounts Payable | ||||||||||
| Capital Expenditure | ||||||||||
| UFCF | 112.4 | 97.4 | 62.4 | -19.2 | -505.9 | -10.5 | -28.0 | -28.2 | -28.4 | -28.7 |
| WACC, % | 8.87 | 8.87 | 8.87 | 8.87 | 8.87 | 8.87 | 8.87 | 8.87 | 8.87 | 8.87 |
| PV UFCF | ||||||||||
| SUM PV UFCF | -94.1 | |||||||||
| Long Term Growth Rate, % | 4.00 | |||||||||
| Free cash flow (T + 1) | -30 | |||||||||
| Terminal Value | -613 | |||||||||
| Present Terminal Value | -401 | |||||||||
| Enterprise Value | -495 | |||||||||
| Net Debt | -281 | |||||||||
| Equity Value | -213 | |||||||||
| Diluted Shares Outstanding, MM | 337 | |||||||||
| Equity Value Per Share | -0.63 |
Benefits of Choosing Longmaster Information & Technology Co., Ltd. (300288SZ)
- Comprehensive Financial Data: Access to detailed financial metrics – from revenue to EBIT – based on real and projected data.
- Complete Customization: Modify all essential inputs (yellow cells) such as WACC, growth percentage, and tax rates.
- Real-Time Valuation Adjustments: Automated recalculations to evaluate the effects of changes on Longmaster's fair value.
- Flexible Excel Template: Designed for easy modifications, scenario analysis, and thorough forecasts.
- Efficient and Precise: Eliminate the need to develop models from the ground up while ensuring accuracy and adaptability.
Key Features
- Comprehensive DCF Calculator: Offers in-depth unlevered and levered DCF valuation models tailored for Longmaster Information & Technology Co., Ltd. (300288SZ).
- WACC Measurement Tool: Features a pre-configured Weighted Average Cost of Capital sheet with adjustable parameters.
- Customizable Forecast Inputs: Easily alter growth projections, capital expenditures, and discount rates.
- Integrated Financial Ratios: Evaluate profitability, leverage, and efficiency metrics specifically for Longmaster Information & Technology Co., Ltd. (300288SZ).
- Interactive Dashboard and Charts: Visual representations highlight essential valuation metrics for straightforward analysis.
How It Works
- Step 1: Download the Excel file.
- Step 2: Review the pre-filled data for Longmaster Information & Technology Co., Ltd. (300288SZ) (historical and projected).
- Step 3: Modify key assumptions (highlighted in yellow) according to your analysis.
- Step 4: Check the automatic recalculations for the intrinsic value of Longmaster Information & Technology Co., Ltd. (300288SZ).
- Step 5: Utilize the generated outputs for your investment strategies or reporting needs.
Why Opt for This Calculator?
- Designed for Experts: A sophisticated tool utilized by analysts, CFOs, and consultants.
- Comprehensive Data: Longmaster Information & Technology Co., Ltd.'s historical and projected financials are preloaded for precision.
- Scenario Analysis: Effortlessly simulate various forecasts and assumptions.
- Clear Results: Instantly computes intrinsic value, NPV, and essential metrics.
- User-Friendly: Step-by-step guidance ensures a smooth experience.
Who Can Benefit from Longmaster Information & Technology Co., Ltd. (300288SZ)?
- Tech Students: Explore data analytics and software development through hands-on projects.
- Researchers: Utilize advanced technologies in your studies and publications.
- Investors: Validate your investment strategies and assess the performance of Longmaster Information & Technology Co., Ltd. (300288SZ).
- Data Analysts: Enhance your efficiency with customizable analytics tools designed for comprehensive insights.
- Entrepreneurs: Learn from the strategies employed by leading tech companies in the industry.
Contents of the Template
- Historical Data: Contains Longmaster Information & Technology Co., Ltd.’s past financial records and baseline forecasts.
- DCF and Levered DCF Models: Comprehensive templates to assess the intrinsic value of Longmaster Information & Technology Co., Ltd. (300288SZ).
- WACC Sheet: Pre-configured calculations for Weighted Average Cost of Capital.
- Editable Inputs: Customize essential drivers such as growth rates, EBITDA %, and CAPEX assumptions.
- Quarterly and Annual Statements: An in-depth analysis of Longmaster Information & Technology Co., Ltd. (300288SZ)’s financial performance.
- Interactive Dashboard: Dynamically visualize valuation results and forecasts.
Disclaimer
All information, articles, and product details provided on this website are for general informational and educational purposes only. We do not claim any ownership over, nor do we intend to infringe upon, any trademarks, copyrights, logos, brand names, or other intellectual property mentioned or depicted on this site. Such intellectual property remains the property of its respective owners, and any references here are made solely for identification or informational purposes, without implying any affiliation, endorsement, or partnership.
We make no representations or warranties, express or implied, regarding the accuracy, completeness, or suitability of any content or products presented. Nothing on this website should be construed as legal, tax, investment, financial, medical, or other professional advice. In addition, no part of this site—including articles or product references—constitutes a solicitation, recommendation, endorsement, advertisement, or offer to buy or sell any securities, franchises, or other financial instruments, particularly in jurisdictions where such activity would be unlawful.
All content is of a general nature and may not address the specific circumstances of any individual or entity. It is not a substitute for professional advice or services. Any actions you take based on the information provided here are strictly at your own risk. You accept full responsibility for any decisions or outcomes arising from your use of this website and agree to release us from any liability in connection with your use of, or reliance upon, the content or products found herein.