
|
Ningbo Cixing Co., Ltd. (300307.SZ) Évaluation DCF |
Entièrement Modifiable: Adapté À Vos Besoins Dans Excel Ou Sheets
Conception Professionnelle: Modèles Fiables Et Conformes Aux Normes Du Secteur
Pré-Construits Pour Une Utilisation Rapide Et Efficace
Compatible MAC/PC, entièrement débloqué
Aucune Expertise N'Est Requise; Facile À Suivre
Ningbo Cixing Co.,Ltd. (300307.SZ) Bundle
Que vous soyez un investisseur ou un analyste, cette calculatrice DCF (300307SZ) est votre ressource incontournable pour une évaluation précise. Chargé de données réelles de Ningbo Cixing Co., Ltd., vous pouvez ajuster les prévisions et observer instantanément les effets.
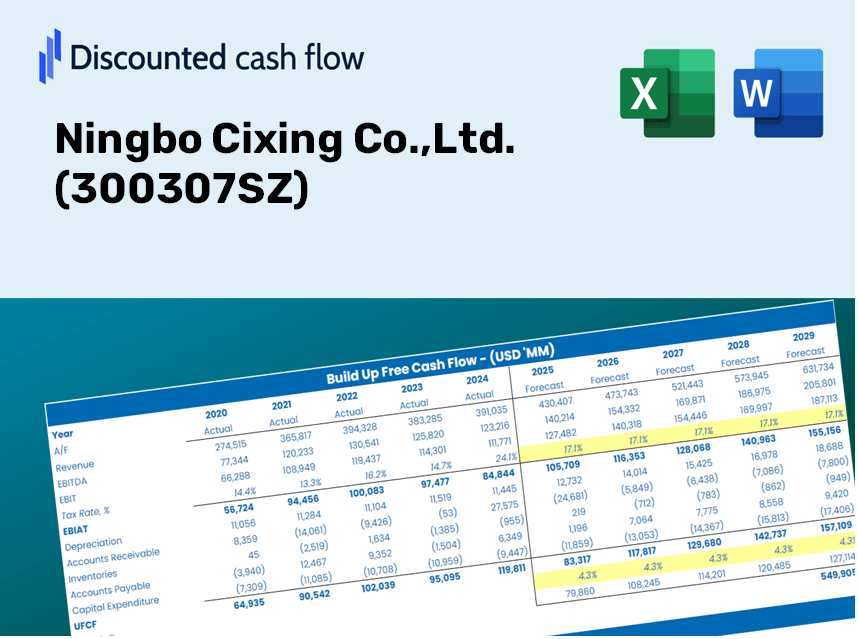
Discounted Cash Flow (DCF) - (USD MM)
| Year | AY1 2020 |
AY2 2021 |
AY3 2022 |
AY4 2023 |
AY5 2024 |
FY1 2025 |
FY2 2026 |
FY3 2027 |
FY4 2028 |
FY5 2029 |
|---|---|---|---|---|---|---|---|---|---|---|
| Revenue | 1,233.3 | 2,131.2 | 1,900.8 | 2,032.0 | 2,218.2 | 2,651.1 | 3,168.5 | 3,786.8 | 4,525.8 | 5,409.0 |
| Revenue Growth, % | 0 | 72.8 | -10.81 | 6.9 | 9.16 | 19.51 | 19.51 | 19.51 | 19.51 | 19.51 |
| EBITDA | -441.0 | 190.1 | 246.0 | 213.0 | 400.4 | 77.6 | 92.8 | 110.9 | 132.5 | 158.4 |
| EBITDA, % | -35.75 | 8.92 | 12.94 | 10.48 | 18.05 | 2.93 | 2.93 | 2.93 | 2.93 | 2.93 |
| Depreciation | 104.5 | 110.4 | 109.2 | 84.8 | 82.6 | 144.7 | 173.0 | 206.7 | 247.1 | 295.3 |
| Depreciation, % | 8.48 | 5.18 | 5.74 | 4.17 | 3.72 | 5.46 | 5.46 | 5.46 | 5.46 | 5.46 |
| EBIT | -545.5 | 79.7 | 136.8 | 128.2 | 317.9 | -67.1 | -80.2 | -95.9 | -114.6 | -136.9 |
| EBIT, % | -44.23 | 3.74 | 7.2 | 6.31 | 14.33 | -2.53 | -2.53 | -2.53 | -2.53 | -2.53 |
| Total Cash | 799.9 | 540.2 | 556.6 | 328.4 | 343.2 | 801.3 | 957.7 | 1,144.6 | 1,367.9 | 1,634.9 |
| Total Cash, percent | .0 | .0 | .0 | .0 | .0 | .0 | .0 | .0 | .0 | .0 |
| Account Receivables | 532.9 | 835.7 | 982.9 | 678.1 | 446.6 | 994.9 | 1,189.0 | 1,421.0 | 1,698.4 | 2,029.8 |
| Account Receivables, % | 43.21 | 39.22 | 51.71 | 33.37 | 20.13 | 37.53 | 37.53 | 37.53 | 37.53 | 37.53 |
| Inventories | 682.5 | 783.6 | 913.0 | 1,087.0 | 1,335.4 | 1,345.9 | 1,608.5 | 1,922.4 | 2,297.6 | 2,746.0 |
| Inventories, % | 55.34 | 36.77 | 48.03 | 53.49 | 60.2 | 50.77 | 50.77 | 50.77 | 50.77 | 50.77 |
| Accounts Payable | 524.8 | 500.6 | 801.2 | 867.7 | 923.8 | 1,020.9 | 1,220.1 | 1,458.2 | 1,742.8 | 2,082.9 |
| Accounts Payable, % | 42.55 | 23.49 | 42.15 | 42.7 | 41.65 | 38.51 | 38.51 | 38.51 | 38.51 | 38.51 |
| Capital Expenditure | -185.9 | -48.8 | -78.3 | -31.3 | -87.2 | -142.9 | -170.8 | -204.1 | -244.0 | -291.6 |
| Capital Expenditure, % | -15.07 | -2.29 | -4.12 | -1.54 | -3.93 | -5.39 | -5.39 | -5.39 | -5.39 | -5.39 |
| Tax Rate, % | 9.52 | 9.52 | 9.52 | 9.52 | 9.52 | 9.52 | 9.52 | 9.52 | 9.52 | 9.52 |
| EBITAT | -516.8 | 111.7 | 135.1 | 129.2 | 287.6 | -65.0 | -77.6 | -92.8 | -110.9 | -132.5 |
| Depreciation | ||||||||||
| Changes in Account Receivables | ||||||||||
| Changes in Inventories | ||||||||||
| Changes in Accounts Payable | ||||||||||
| Capital Expenditure | ||||||||||
| UFCF | -1,288.7 | -255.0 | 190.0 | 380.1 | 322.2 | -524.8 | -333.0 | -398.0 | -475.7 | -568.5 |
| WACC, % | 5.13 | 5.15 | 5.14 | 5.15 | 5.12 | 5.14 | 5.14 | 5.14 | 5.14 | 5.14 |
| PV UFCF | ||||||||||
| SUM PV UFCF | -1,974.7 | |||||||||
| Long Term Growth Rate, % | 3.00 | |||||||||
| Free cash flow (T + 1) | -586 | |||||||||
| Terminal Value | -27,392 | |||||||||
| Present Terminal Value | -21,322 | |||||||||
| Enterprise Value | -23,297 | |||||||||
| Net Debt | 72 | |||||||||
| Equity Value | -23,368 | |||||||||
| Diluted Shares Outstanding, MM | 788 | |||||||||
| Equity Value Per Share | -29.64 |
What You Will Get
- Authentic Ningbo Cixing Data: Preloaded financial metrics – ranging from revenue to EBIT – derived from real and projected numbers.
- Comprehensive Customization: Modify all key parameters (highlighted cells) such as WACC, growth %, and tax rates.
- Immediate Valuation Updates: Automatic recalculations to assess the effect of changes on Ningbo Cixing’s fair value.
- Flexible Excel Template: Designed for quick modifications, scenario analysis, and in-depth projections.
- Efficient and Accurate: Avoid the hassle of building models from the ground up while ensuring accuracy and adaptability.
Highlight Features
- Comprehensive DCF Calculator: Offers detailed unlevered and levered DCF valuation models tailored for Ningbo Cixing Co., Ltd. (300307SZ).
- WACC Tool: Features a pre-designed Weighted Average Cost of Capital sheet with adjustable parameters.
- Customizable Forecast Inputs: Easily adjust growth rates, capital expenditure forecasts, and discount rates.
- Integrated Financial Ratios: Evaluate profitability, leverage, and efficiency ratios specific to Ningbo Cixing Co., Ltd. (300307SZ).
- Interactive Dashboard and Visuals: Graphical outputs presenting essential valuation metrics for straightforward analysis.
How It Operates
- 1. Access the Template: Download and open the Excel file containing Ningbo Cixing Co., Ltd.'s (300307SZ) preloaded data.
- 2. Modify Assumptions: Adjust crucial inputs such as growth rates, WACC, and capital expenditures.
- 3. View Results in Real-Time: The DCF model automatically calculates intrinsic value and NPV.
- 4. Explore Different Scenarios: Analyze various forecasts to evaluate distinct valuation scenarios.
- 5. Present with Assurance: Share professional valuation insights to bolster your strategic decisions.
Why Choose Ningbo Cixing Co.,Ltd. Calculator?
- All-in-One Solution: Combines DCF, WACC, and financial ratio analyses seamlessly.
- Flexible Customization: Modify highlighted fields to explore different scenarios.
- In-Depth Analysis: Automatically computes Ningbo Cixing’s intrinsic value and Net Present Value.
- Built-In Data: Historical and projected information offers reliable baseline figures.
- Expert-Grade Tool: Perfect for financial analysts, investors, and business advisors.
Who Can Benefit from Our Solutions?
- Textile Engineering Students: Acquire hands-on experience with the latest industry technologies and methodologies.
- Researchers: Utilize our advanced data models in your studies and publications.
- Investors: Validate your investment strategies and evaluate the performance metrics of Ningbo Cixing Co.,Ltd. (300307SZ).
- Industry Analysts: Enhance your analysis with our customizable financial models tailored for the textile sector.
- Entrepreneurs: Discover how established companies like Ningbo Cixing Co.,Ltd. (300307SZ) navigate market dynamics.
Contents of the Template
- Pre-Filled DCF Model: Ningbo Cixing Co., Ltd.'s financial data ready for immediate analysis.
- WACC Calculator: Comprehensive calculations for Weighted Average Cost of Capital.
- Financial Ratios: Assess Ningbo Cixing Co., Ltd.'s profitability, leverage, and operational efficiency.
- Editable Inputs: Adjust assumptions like growth rates, margins, and capital expenditures to suit your situation.
- Financial Statements: Annual and quarterly reports available for in-depth evaluation.
- Interactive Dashboard: Effortlessly visualize essential valuation metrics and outcomes.
Disclaimer
All information, articles, and product details provided on this website are for general informational and educational purposes only. We do not claim any ownership over, nor do we intend to infringe upon, any trademarks, copyrights, logos, brand names, or other intellectual property mentioned or depicted on this site. Such intellectual property remains the property of its respective owners, and any references here are made solely for identification or informational purposes, without implying any affiliation, endorsement, or partnership.
We make no representations or warranties, express or implied, regarding the accuracy, completeness, or suitability of any content or products presented. Nothing on this website should be construed as legal, tax, investment, financial, medical, or other professional advice. In addition, no part of this site—including articles or product references—constitutes a solicitation, recommendation, endorsement, advertisement, or offer to buy or sell any securities, franchises, or other financial instruments, particularly in jurisdictions where such activity would be unlawful.
All content is of a general nature and may not address the specific circumstances of any individual or entity. It is not a substitute for professional advice or services. Any actions you take based on the information provided here are strictly at your own risk. You accept full responsibility for any decisions or outcomes arising from your use of this website and agree to release us from any liability in connection with your use of, or reliance upon, the content or products found herein.