
|
Lizhong Sitong Light Alloys Group Co., Ltd. (300428.SZ) Valation DCF |
Entièrement Modifiable: Adapté À Vos Besoins Dans Excel Ou Sheets
Conception Professionnelle: Modèles Fiables Et Conformes Aux Normes Du Secteur
Pré-Construits Pour Une Utilisation Rapide Et Efficace
Compatible MAC/PC, entièrement débloqué
Aucune Expertise N'Est Requise; Facile À Suivre
Lizhong Sitong Light Alloys Group Co., Ltd. (300428.SZ) Bundle
Explorez l'avenir financier de Lizhong Sitong Light Alloys Group Co., Ltd. (300428SZ) avec notre calculatrice DCF conviviale! Entrez vos hypothèses concernant la croissance, les marges et les coûts pour calculer la valeur intrinsèque de Lizhong Sitong Light Alloys Group Co., Ltd. (300428SZ) et améliorez votre stratégie d'investissement.
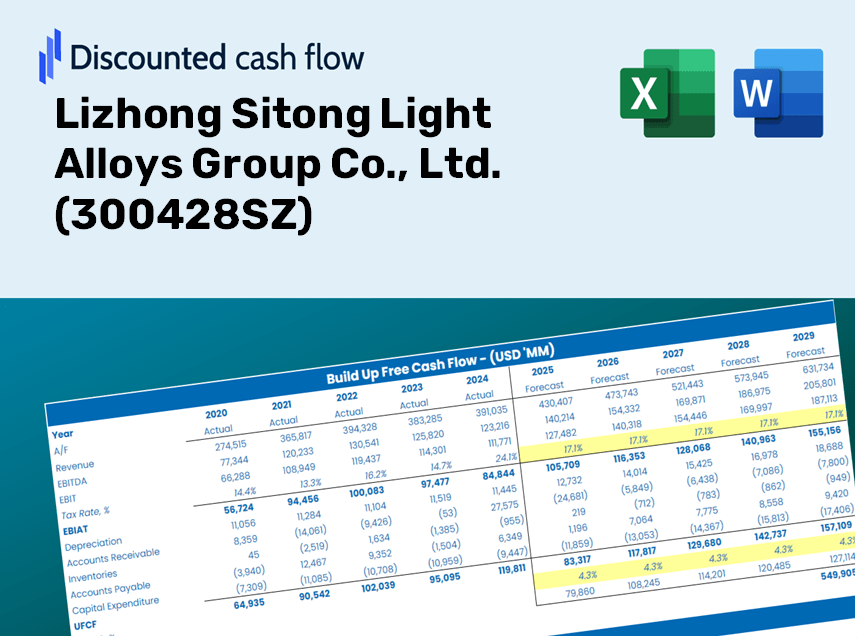
Discounted Cash Flow (DCF) - (USD MM)
| Year | AY1 2020 |
AY2 2021 |
AY3 2022 |
AY4 2023 |
AY5 2024 |
FY1 2025 |
FY2 2026 |
FY3 2027 |
FY4 2028 |
FY5 2029 |
|---|---|---|---|---|---|---|---|---|---|---|
| Revenue | 13,391.6 | 18,633.7 | 21,371.4 | 23,364.9 | 27,246.4 | 32,680.5 | 39,198.4 | 47,016.2 | 56,393.2 | 67,640.5 |
| Revenue Growth, % | 0 | 39.14 | 14.69 | 9.33 | 16.61 | 19.94 | 19.94 | 19.94 | 19.94 | 19.94 |
| EBITDA | 1,053.3 | 1,088.0 | 1,222.0 | 1,504.9 | 1,709.4 | 2,100.5 | 2,519.4 | 3,021.9 | 3,624.6 | 4,347.5 |
| EBITDA, % | 7.87 | 5.84 | 5.72 | 6.44 | 6.27 | 6.43 | 6.43 | 6.43 | 6.43 | 6.43 |
| Depreciation | 314.0 | 338.5 | 386.9 | 482.0 | 555.4 | 658.4 | 789.7 | 947.2 | 1,136.1 | 1,362.6 |
| Depreciation, % | 2.34 | 1.82 | 1.81 | 2.06 | 2.04 | 2.01 | 2.01 | 2.01 | 2.01 | 2.01 |
| EBIT | 739.4 | 749.5 | 835.1 | 1,022.9 | 1,153.9 | 1,442.1 | 1,729.7 | 2,074.7 | 2,488.5 | 2,984.8 |
| EBIT, % | 5.52 | 4.02 | 3.91 | 4.38 | 4.24 | 4.41 | 4.41 | 4.41 | 4.41 | 4.41 |
| Total Cash | 2,146.6 | 2,255.9 | 2,714.7 | 2,911.1 | 2,721.1 | 4,136.4 | 4,961.3 | 5,950.8 | 7,137.7 | 8,561.3 |
| Total Cash, percent | .0 | .0 | .0 | .0 | .0 | .0 | .0 | .0 | .0 | .0 |
| Account Receivables | 3,603.2 | 4,519.6 | 4,864.9 | 5,349.6 | 6,867.6 | 7,975.7 | 9,566.5 | 11,474.4 | 13,762.9 | 16,507.8 |
| Account Receivables, % | 26.91 | 24.26 | 22.76 | 22.9 | 25.21 | 24.41 | 24.41 | 24.41 | 24.41 | 24.41 |
| Inventories | 2,028.1 | 3,221.9 | 3,665.0 | 3,747.3 | 4,608.1 | 5,394.6 | 6,470.5 | 7,761.0 | 9,308.9 | 11,165.5 |
| Inventories, % | 15.14 | 17.29 | 17.15 | 16.04 | 16.91 | 16.51 | 16.51 | 16.51 | 16.51 | 16.51 |
| Accounts Payable | 1,251.6 | 1,657.1 | 1,533.3 | 1,918.9 | 2,133.6 | 2,709.7 | 3,250.1 | 3,898.3 | 4,675.8 | 5,608.4 |
| Accounts Payable, % | 9.35 | 8.89 | 7.17 | 8.21 | 7.83 | 8.29 | 8.29 | 8.29 | 8.29 | 8.29 |
| Capital Expenditure | -482.3 | -839.8 | -1,258.5 | -1,115.9 | -991.0 | -1,464.7 | -1,756.9 | -2,107.3 | -2,527.6 | -3,031.7 |
| Capital Expenditure, % | -3.6 | -4.51 | -5.89 | -4.78 | -3.64 | -4.48 | -4.48 | -4.48 | -4.48 | -4.48 |
| Tax Rate, % | 15.65 | 15.65 | 15.65 | 15.65 | 15.65 | 15.65 | 15.65 | 15.65 | 15.65 | 15.65 |
| EBITAT | 556.2 | 611.7 | 765.7 | 871.9 | 973.3 | 1,206.0 | 1,446.5 | 1,735.0 | 2,081.0 | 2,496.0 |
| Depreciation | ||||||||||
| Changes in Account Receivables | ||||||||||
| Changes in Inventories | ||||||||||
| Changes in Accounts Payable | ||||||||||
| Capital Expenditure | ||||||||||
| UFCF | -3,991.9 | -1,594.3 | -1,018.1 | 56.6 | -1,626.3 | -919.0 | -1,646.9 | -1,975.4 | -2,369.4 | -2,841.9 |
| WACC, % | 3.91 | 4.01 | 4.16 | 4.06 | 4.05 | 4.04 | 4.04 | 4.04 | 4.04 | 4.04 |
| PV UFCF | ||||||||||
| SUM PV UFCF | -8,512.9 | |||||||||
| Long Term Growth Rate, % | 3.00 | |||||||||
| Free cash flow (T + 1) | -2,927 | |||||||||
| Terminal Value | -281,839 | |||||||||
| Present Terminal Value | -231,221 | |||||||||
| Enterprise Value | -239,734 | |||||||||
| Net Debt | 7,731 | |||||||||
| Equity Value | -247,466 | |||||||||
| Diluted Shares Outstanding, MM | 649 | |||||||||
| Equity Value Per Share | -381.46 |
What You Will Receive
- Authentic Lizhong Data: Preloaded financials – encompassing revenue and EBIT – derived from actual and projected figures.
- Comprehensive Customization: Modify all essential parameters (yellow cells) such as WACC, growth %, and tax rates.
- Instant Valuation Adjustments: Automatic recalculations to evaluate the influence of changes on the fair value of Lizhong Sitong Light Alloys Group Co., Ltd. (300428SZ).
- Flexible Excel Template: Designed for quick modifications, scenario analysis, and thorough projections.
- Efficient and Precise: Avoid the hassle of building models from the ground up while ensuring accuracy and adaptability.
Key Features
- Comprehensive Data: Lizhong Sitong Light Alloys Group Co., Ltd.'s historical financial records and pre-filled projections.
- Customizable Inputs: Adjust WACC, tax rates, revenue growth, and EBITDA margins to fit your analysis.
- Real-Time Insights: Instantly view the intrinsic value of Lizhong Sitong recalculating on-the-fly.
- Intuitive Visualizations: Dashboard graphs illustrate valuation results and essential metrics clearly.
- Precision Engineered: A reliable tool designed for analysts, investors, and finance professionals.
How It Works
- Step 1: Download the Excel file for Lizhong Sitong Light Alloys Group Co., Ltd. (300428SZ).
- Step 2: Review the pre-filled financial data and forecasts for Lizhong Sitong.
- Step 3: Adjust key inputs such as revenue growth, WACC, and tax rates (indicated in highlighted cells).
- Step 4: Observe the DCF model refresh in real-time as you modify the assumptions.
- Step 5: Evaluate the outputs and leverage the findings for your investment strategies.
Why Select This Calculator for Lizhong Sitong Light Alloys Group Co., Ltd. (300428SZ)?
- Precision: Utilizes accurate financial data from Lizhong Sitong to ensure reliable results.
- Customizability: Allows users to easily adjust and test various inputs according to their needs.
- Efficiency: Eliminate the complexities of creating a DCF model from the ground up.
- High-Quality: Created with the standards and usability expected by CFOs in mind.
- Accessible: Intuitive design makes it straightforward for users without extensive financial modeling backgrounds.
Who Can Benefit from Lizhong Sitong Light Alloys Group Co., Ltd. (300428SZ)?
- Investors: Gain the insights needed for informed investment choices with our advanced valuation solutions.
- Financial Analysts: Boost your efficiency using our ready-to-tailor DCF models designed for precise analysis.
- Consultants: Seamlessly modify templates for impactful client presentations and detailed reports.
- Finance Enthusiasts: Expand your knowledge of valuation strategies through practical, real-world applications.
- Educators and Students: Leverage our resources as a hands-on learning aid in finance courses.
Contents of the Template
- Preloaded LZSL Data: Historical and projected financial figures, including revenue, EBIT, and capital expenditures.
- DCF and WACC Models: Advanced spreadsheets for determining intrinsic value and Weighted Average Cost of Capital.
- Editable Inputs: Yellow-highlighted cells for modifying revenue growth, tax rates, and discount rates.
- Financial Statements: Detailed annual and quarterly financials for thorough analysis.
- Key Ratios: Ratios for profitability, leverage, and efficiency to assess performance.
- Dashboard and Charts: Visual representations of valuation results and underlying assumptions.
Disclaimer
All information, articles, and product details provided on this website are for general informational and educational purposes only. We do not claim any ownership over, nor do we intend to infringe upon, any trademarks, copyrights, logos, brand names, or other intellectual property mentioned or depicted on this site. Such intellectual property remains the property of its respective owners, and any references here are made solely for identification or informational purposes, without implying any affiliation, endorsement, or partnership.
We make no representations or warranties, express or implied, regarding the accuracy, completeness, or suitability of any content or products presented. Nothing on this website should be construed as legal, tax, investment, financial, medical, or other professional advice. In addition, no part of this site—including articles or product references—constitutes a solicitation, recommendation, endorsement, advertisement, or offer to buy or sell any securities, franchises, or other financial instruments, particularly in jurisdictions where such activity would be unlawful.
All content is of a general nature and may not address the specific circumstances of any individual or entity. It is not a substitute for professional advice or services. Any actions you take based on the information provided here are strictly at your own risk. You accept full responsibility for any decisions or outcomes arising from your use of this website and agree to release us from any liability in connection with your use of, or reliance upon, the content or products found herein.