
|
Guangzhou Great Power Energy and Technology Co., Ltd (300438.SZ) Valation DCF |
Entièrement Modifiable: Adapté À Vos Besoins Dans Excel Ou Sheets
Conception Professionnelle: Modèles Fiables Et Conformes Aux Normes Du Secteur
Pré-Construits Pour Une Utilisation Rapide Et Efficace
Compatible MAC/PC, entièrement débloqué
Aucune Expertise N'Est Requise; Facile À Suivre
Guangzhou Great Power Energy and Technology Co., Ltd (300438.SZ) Bundle
Conçu pour la précision, notre calculatrice DCF (300438SZ) vous permet d'évaluer l'évaluation de Guangzhou Great Power Energy and Technology Co., Ltd en utilisant des données financières réelles, tout en offrant une flexibilité complète pour ajuster tous les paramètres clés pour des projections améliorées.
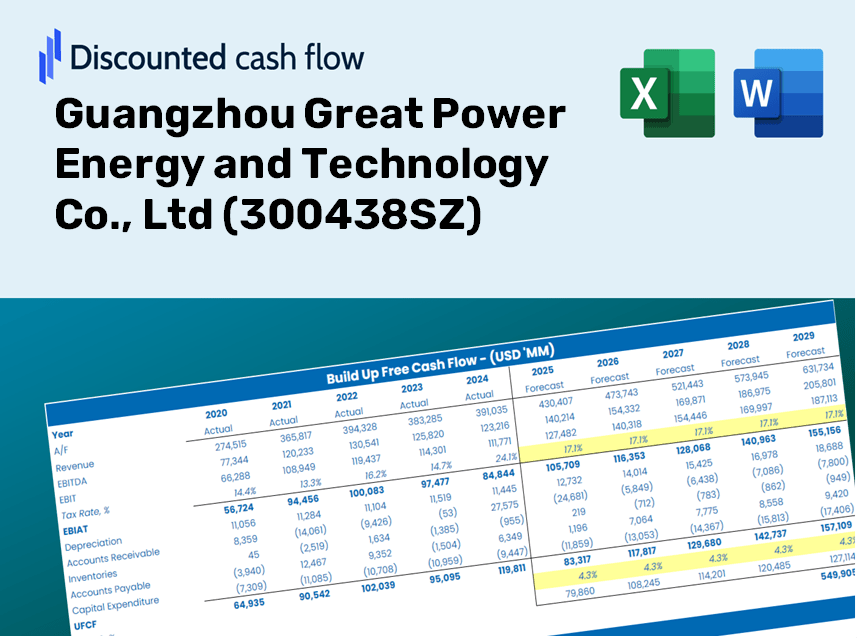
Discounted Cash Flow (DCF) - (USD MM)
| Year | AY1 2020 |
AY2 2021 |
AY3 2022 |
AY4 2023 |
AY5 2024 |
FY1 2025 |
FY2 2026 |
FY3 2027 |
FY4 2028 |
FY5 2029 |
|---|---|---|---|---|---|---|---|---|---|---|
| Revenue | 3,642.2 | 5,692.9 | 9,066.7 | 6,932.5 | 7,960.5 | 10,087.1 | 12,781.7 | 16,196.3 | 20,522.9 | 26,005.5 |
| Revenue Growth, % | 0 | 56.3 | 59.26 | -23.54 | 14.83 | 26.71 | 26.71 | 26.71 | 26.71 | 26.71 |
| EBITDA | 357.7 | 546.3 | 1,160.8 | 658.5 | 368.6 | 935.0 | 1,184.8 | 1,501.3 | 1,902.4 | 2,410.6 |
| EBITDA, % | 9.82 | 9.6 | 12.8 | 9.5 | 4.63 | 9.27 | 9.27 | 9.27 | 9.27 | 9.27 |
| Depreciation | 257.5 | 309.5 | 424.8 | 563.4 | 688.6 | 685.3 | 868.4 | 1,100.3 | 1,394.3 | 1,766.8 |
| Depreciation, % | 7.07 | 5.44 | 4.69 | 8.13 | 8.65 | 6.79 | 6.79 | 6.79 | 6.79 | 6.79 |
| EBIT | 100.2 | 236.8 | 736.0 | 95.1 | -320.1 | 249.7 | 316.5 | 401.0 | 508.1 | 643.9 |
| EBIT, % | 2.75 | 4.16 | 8.12 | 1.37 | -4.02 | 2.48 | 2.48 | 2.48 | 2.48 | 2.48 |
| Total Cash | 1,476.4 | 1,287.3 | 1,298.8 | 2,262.2 | 1,751.1 | 2,665.1 | 3,377.0 | 4,279.1 | 5,422.3 | 6,870.8 |
| Total Cash, percent | .0 | .0 | .0 | .0 | .0 | .0 | .0 | .0 | .0 | .0 |
| Account Receivables | 1,913.8 | 1,821.8 | 3,041.3 | 2,345.6 | 3,881.0 | 4,048.5 | 5,130.1 | 6,500.5 | 8,237.1 | 10,437.5 |
| Account Receivables, % | 52.55 | 32 | 33.54 | 33.83 | 48.75 | 40.14 | 40.14 | 40.14 | 40.14 | 40.14 |
| Inventories | 876.6 | 1,604.2 | 2,607.7 | 3,102.5 | 2,798.0 | 3,246.2 | 4,113.4 | 5,212.3 | 6,604.7 | 8,369.1 |
| Inventories, % | 24.07 | 28.18 | 28.76 | 44.75 | 35.15 | 32.18 | 32.18 | 32.18 | 32.18 | 32.18 |
| Accounts Payable | 2,480.1 | 3,316.4 | 4,284.3 | 4,852.1 | 6,068.5 | 6,452.2 | 8,175.8 | 10,359.9 | 13,127.5 | 16,634.4 |
| Accounts Payable, % | 68.09 | 58.25 | 47.25 | 69.99 | 76.23 | 63.96 | 63.96 | 63.96 | 63.96 | 63.96 |
| Capital Expenditure | -341.9 | -631.9 | -1,205.5 | -1,464.4 | -542.7 | -1,245.2 | -1,577.9 | -1,999.4 | -2,533.5 | -3,210.4 |
| Capital Expenditure, % | -9.39 | -11.1 | -13.3 | -21.12 | -6.82 | -12.34 | -12.34 | -12.34 | -12.34 | -12.34 |
| Tax Rate, % | 24.85 | 24.85 | 24.85 | 24.85 | 24.85 | 24.85 | 24.85 | 24.85 | 24.85 | 24.85 |
| EBITAT | 74.1 | 235.8 | 677.8 | 167.3 | -240.5 | 220.2 | 279.0 | 353.5 | 447.9 | 567.6 |
| Depreciation | ||||||||||
| Changes in Account Receivables | ||||||||||
| Changes in Inventories | ||||||||||
| Changes in Accounts Payable | ||||||||||
| Capital Expenditure | ||||||||||
| UFCF | -320.7 | 114.1 | -1,357.9 | 34.9 | -109.0 | -571.9 | -655.7 | -830.8 | -1,052.7 | -1,334.0 |
| WACC, % | 5.86 | 5.97 | 5.94 | 5.97 | 5.86 | 5.92 | 5.92 | 5.92 | 5.92 | 5.92 |
| PV UFCF | ||||||||||
| SUM PV UFCF | -3,660.4 | |||||||||
| Long Term Growth Rate, % | 3.50 | |||||||||
| Free cash flow (T + 1) | -1,381 | |||||||||
| Terminal Value | -57,034 | |||||||||
| Present Terminal Value | -42,779 | |||||||||
| Enterprise Value | -46,439 | |||||||||
| Net Debt | 1,105 | |||||||||
| Equity Value | -47,544 | |||||||||
| Diluted Shares Outstanding, MM | 505 | |||||||||
| Equity Value Per Share | -94.16 |
What You Will Receive
- GREAT Financials: Access to both historical and projected data for precise valuation.
- Customizable Inputs: Adjust WACC, tax rates, revenue growth, and capital expenditures as needed.
- Instant Calculations: Intrinsic value and NPV are computed in real-time.
- Scenario Analysis: Evaluate various scenarios to assess the future performance of Guangzhou Great Power Energy and Technology Co., Ltd (300438SZ).
- User-Friendly Interface: Designed for professionals but easy to navigate for newcomers.
Key Features
- Comprehensive DCF Calculator: Features both unlevered and levered DCF valuation models tailored for Guangzhou Great Power Energy and Technology Co., Ltd (300438SZ).
- WACC Calculator: Ready-to-use Weighted Average Cost of Capital tool with adjustable input parameters.
- Customizable Forecast Assumptions: Adjust growth rates, capital expenditures, and discount rates as needed.
- Integrated Financial Ratios: Evaluate profitability, leverage, and efficiency ratios specific to Guangzhou Great Power Energy and Technology Co., Ltd (300438SZ).
- Visual Dashboard and Charts: Graphical representations of key valuation metrics for straightforward analysis.
How It Operates
- Step 1: Download the Excel workbook.
- Step 2: Examine Great Power Energy's pre-filled financial metrics and projections.
- Step 3: Adjust essential parameters such as revenue growth, WACC, and tax rates (marked cells).
- Step 4: Observe the DCF model refreshing in real-time as you modify your assumptions.
- Step 5: Review the outcomes and utilize the findings for your investment strategies.
Why Choose This Calculator for Guangzhou Great Power Energy and Technology Co., Ltd (300438SZ)?
- Precise Financial Insights: Utilize real financial data from Great Power for trustworthy valuation outcomes.
- Fully Customizable: Modify essential inputs such as growth rates, WACC, and tax rates to align with your forecasts.
- Efficiency Boost: Built-in calculations save you the hassle of beginning from square one.
- Professional-Quality Tool: Tailored for investors, analysts, and consultants in the energy sector.
- Easy to Use: Simplified layout and guided instructions ensure a smooth experience for every user.
Who Can Benefit from This Product?
- Individual Investors: Gain insights to make informed choices regarding buying or selling shares of Guangzhou Great Power Energy and Technology Co., Ltd (300438SZ).
- Financial Analysts: Enhance valuation processes with comprehensive financial models designed specifically for this company.
- Consultants: Provide clients with timely and accurate valuation analyses tailored to Guangzhou Great Power Energy and Technology Co., Ltd (300438SZ).
- Business Owners: Learn how major firms like Guangzhou Great Power Energy and Technology Co., Ltd (300438SZ) are valued to inform your strategic planning.
- Finance Students: Acquire practical valuation skills using real data and case studies from Guangzhou Great Power Energy and Technology Co., Ltd (300438SZ).
What the Template Contains
- Preloaded 300438SZ Data: Historical and forecasted financial metrics, including revenue, EBIT, and capital expenditures.
- DCF and WACC Models: Advanced sheets for determining intrinsic value and calculating Weighted Average Cost of Capital.
- Editable Inputs: Yellow-highlighted fields for adjusting revenue growth rates, tax assumptions, and discount rates.
- Financial Statements: Detailed annual and quarterly financial reports for in-depth analysis.
- Key Ratios: Metrics on profitability, leverage, and efficiency for performance evaluation.
- Dashboard and Charts: Visual representations of valuation results and underlying assumptions.
Disclaimer
All information, articles, and product details provided on this website are for general informational and educational purposes only. We do not claim any ownership over, nor do we intend to infringe upon, any trademarks, copyrights, logos, brand names, or other intellectual property mentioned or depicted on this site. Such intellectual property remains the property of its respective owners, and any references here are made solely for identification or informational purposes, without implying any affiliation, endorsement, or partnership.
We make no representations or warranties, express or implied, regarding the accuracy, completeness, or suitability of any content or products presented. Nothing on this website should be construed as legal, tax, investment, financial, medical, or other professional advice. In addition, no part of this site—including articles or product references—constitutes a solicitation, recommendation, endorsement, advertisement, or offer to buy or sell any securities, franchises, or other financial instruments, particularly in jurisdictions where such activity would be unlawful.
All content is of a general nature and may not address the specific circumstances of any individual or entity. It is not a substitute for professional advice or services. Any actions you take based on the information provided here are strictly at your own risk. You accept full responsibility for any decisions or outcomes arising from your use of this website and agree to release us from any liability in connection with your use of, or reliance upon, the content or products found herein.