
|
Wuxi Lead Intelligent Equipment CO., Ltd. (300450.SZ) Évaluation DCF
CN | Industrials | Industrial - Machinery | SHZ
|
- ✓ Entièrement Modifiable: Adapté À Vos Besoins Dans Excel Ou Sheets
- ✓ Conception Professionnelle: Modèles Fiables Et Conformes Aux Normes Du Secteur
- ✓ Pré-Construits Pour Une Utilisation Rapide Et Efficace
- ✓ Aucune Expertise N'Est Requise; Facile À Suivre
Wuxi Lead Intelligent Equipment CO.,LTD. (300450.SZ) Bundle
Améliorez vos choix d'investissement avec le Wuxi Lead Intelligent Equipment CO., Ltd. (300450SZ) Calculatrice DCF! Utilisez des données financières précises, ajustez les projections et dépenses de croissance et observez instantanément comment ces modifications affectent la valeur intrinsèque de Wuxi Lead Intelligent Equipment Co., Ltd. (300450SZ).
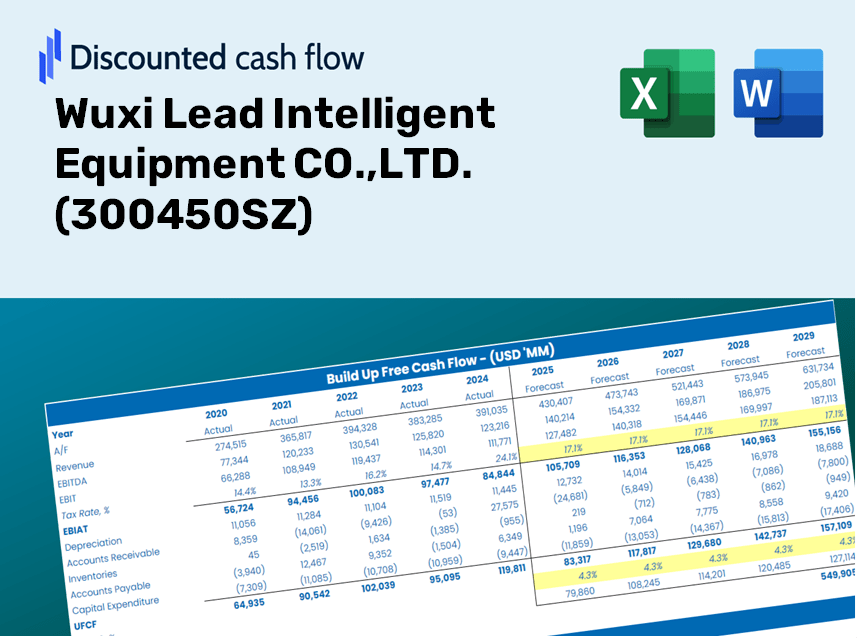
Discounted Cash Flow (DCF) - (USD MM)
| Year | AY1 2019 |
AY2 2020 |
AY3 2021 |
AY4 2022 |
AY5 2023 |
FY1 2024 |
FY2 2025 |
FY3 2026 |
FY4 2027 |
FY5 2028 |
|---|---|---|---|---|---|---|---|---|---|---|
| Revenue | 4,684.0 | 5,858.3 | 10,036.6 | 13,932.4 | 16,628.4 | 17,259.5 | 17,914.5 | 18,594.4 | 19,300.1 | 20,032.6 |
| Revenue Growth, % | 0 | 25.07 | 71.32 | 38.82 | 19.35 | 3.8 | 3.8 | 3.8 | 3.8 | 3.8 |
| EBITDA | 958.7 | 967.9 | 1,944.8 | 2,915.5 | 2,327.8 | 3,151.3 | 3,270.9 | 3,395.1 | 3,523.9 | 3,657.7 |
| EBITDA, % | 20.47 | 16.52 | 19.38 | 20.93 | 14 | 18.26 | 18.26 | 18.26 | 18.26 | 18.26 |
| Depreciation | 69.0 | 90.7 | 234.4 | 347.6 | 460.1 | 366.6 | 380.5 | 394.9 | 409.9 | 425.5 |
| Depreciation, % | 1.47 | 1.55 | 2.34 | 2.49 | 2.77 | 2.12 | 2.12 | 2.12 | 2.12 | 2.12 |
| EBIT | 889.7 | 877.2 | 1,710.4 | 2,567.9 | 1,867.7 | 2,784.8 | 2,890.5 | 3,000.2 | 3,114.0 | 3,232.2 |
| EBIT, % | 18.99 | 14.97 | 17.04 | 18.43 | 11.23 | 16.13 | 16.13 | 16.13 | 16.13 | 16.13 |
| Total Cash | 2,186.0 | 3,061.4 | 6,053.7 | 6,470.1 | 3,728.8 | 7,874.0 | 8,172.8 | 8,483.0 | 8,804.9 | 9,139.1 |
| Total Cash, percent | .0 | .0 | .0 | .0 | .0 | .0 | .0 | .0 | .0 | .0 |
| Account Receivables | 2,827.9 | 4,239.5 | 6,177.8 | 9,272.7 | 12,870.9 | 11,676.1 | 12,119.2 | 12,579.2 | 13,056.6 | 13,552.2 |
| Account Receivables, % | 60.37 | 72.37 | 61.55 | 66.55 | 77.4 | 67.65 | 67.65 | 67.65 | 67.65 | 67.65 |
| Inventories | 2,152.7 | 2,874.4 | 7,776.1 | 12,405.4 | 13,207.0 | 11,769.8 | 12,216.5 | 12,680.2 | 13,161.4 | 13,660.9 |
| Inventories, % | 45.96 | 49.07 | 77.48 | 89.04 | 79.42 | 68.19 | 68.19 | 68.19 | 68.19 | 68.19 |
| Accounts Payable | 1,167.2 | 3,976.2 | 9,270.7 | 9,945.0 | 8,958.9 | 10,715.3 | 11,122.0 | 11,544.1 | 11,982.2 | 12,437.0 |
| Accounts Payable, % | 24.92 | 67.87 | 92.37 | 71.38 | 53.88 | 62.08 | 62.08 | 62.08 | 62.08 | 62.08 |
| Capital Expenditure | -213.6 | -426.2 | -506.6 | -986.8 | -551.6 | -941.8 | -977.5 | -1,014.6 | -1,053.1 | -1,093.1 |
| Capital Expenditure, % | -4.56 | -7.28 | -5.05 | -7.08 | -3.32 | -5.46 | -5.46 | -5.46 | -5.46 | -5.46 |
| Tax Rate, % | 7.12 | 7.12 | 7.12 | 7.12 | 7.12 | 7.12 | 7.12 | 7.12 | 7.12 | 7.12 |
| EBITAT | 815.2 | 802.9 | 1,589.7 | 2,342.8 | 1,734.6 | 2,563.1 | 2,660.4 | 2,761.4 | 2,866.2 | 2,974.9 |
| Depreciation | ||||||||||
| Changes in Account Receivables | ||||||||||
| Changes in Inventories | ||||||||||
| Changes in Accounts Payable | ||||||||||
| Capital Expenditure | ||||||||||
| UFCF | -3,142.8 | 1,143.1 | -227.9 | -5,346.3 | -3,742.8 | 6,376.4 | 1,580.2 | 1,640.2 | 1,702.4 | 1,767.0 |
| WACC, % | 7.3 | 7.3 | 7.31 | 7.3 | 7.31 | 7.3 | 7.3 | 7.3 | 7.3 | 7.3 |
| PV UFCF | ||||||||||
| SUM PV UFCF | 11,168.3 | |||||||||
| Long Term Growth Rate, % | 4.00 | |||||||||
| Free cash flow (T + 1) | 1,838 | |||||||||
| Terminal Value | 55,606 | |||||||||
| Present Terminal Value | 39,086 | |||||||||
| Enterprise Value | 50,254 | |||||||||
| Net Debt | -3,044 | |||||||||
| Equity Value | 53,298 | |||||||||
| Diluted Shares Outstanding, MM | 1,567 | |||||||||
| Equity Value Per Share | 34.01 |
What You Will Receive
- Adjustable Forecast Inputs: Seamlessly modify key assumptions (growth %, margins, WACC) to explore various scenarios.
- Actual Market Data: Wuxi Lead Intelligent Equipment CO.,LTD.'s financial data preloaded to expedite your analysis.
- Automated DCF Outputs: The template computes Net Present Value (NPV) and intrinsic value automatically.
- Customizable and Professional Design: A sleek Excel model that caters to your valuation requirements.
- Engineered for Analysts and Investors: Perfect for evaluating projections, assessing strategies, and enhancing efficiency.
Highlighted Features
- Authentic Financial Data: Gain access to precise pre-loaded historical figures and future forecasts for Wuxi Lead Intelligent Equipment (300450SZ).
- Adjustable Forecast Parameters: Modify the yellow-highlighted fields such as WACC, growth rates, and profit margins.
- Real-Time Calculations: Automatic revisions to DCF, Net Present Value (NPV), and cash flow assessments.
- Interactive Dashboard: User-friendly charts and summaries designed to present your valuation insights clearly.
- Suitable for All Levels: A straightforward, intuitive layout tailored for investors, CFOs, and consultants alike.
How It Works
- Step 1: Download the Excel template.
- Step 2: Examine the pre-filled data for Wuxi Lead Intelligent Equipment CO.,LTD. (300450SZ), including historical and forecasted figures.
- Step 3: Modify key assumptions (highlighted in yellow) according to your analysis.
- Step 4: Observe the automatic recalculations reflecting the intrinsic value of Wuxi Lead Intelligent Equipment CO.,LTD. (300450SZ).
- Step 5: Utilize the results for your investment strategies or reporting needs.
Why Choose This Calculator for Wuxi Lead Intelligent Equipment (300450SZ)?
- User-Friendly Interface: Perfectly crafted for both novices and seasoned professionals.
- Customizable Inputs: Easily adjust parameters to suit your specific analysis needs.
- Real-Time Valuation Updates: Monitor immediate changes in Wuxi’s valuation as you tweak inputs.
- Preloaded Financial Data: Comes equipped with Wuxi’s actual financial metrics for rapid evaluations.
- Endorsed by Industry Experts: A valuable tool for investors and analysts making strategic choices.
Who Can Benefit from This Product?
- Investors: Evaluate the valuation of Wuxi Lead Intelligent Equipment CO.,LTD. (300450SZ) before making investment decisions.
- CFOs and Financial Analysts: Optimize valuation processes and validate financial forecasts.
- Startup Founders: Understand how leading firms like Wuxi Lead are assessed in terms of value.
- Consultants: Provide detailed valuation reports to your clients regarding Wuxi Lead Intelligent Equipment CO.,LTD. (300450SZ).
- Students and Educators: Utilize actual market data to practice and instruct on valuation methodologies.
Contents of the Template
- Comprehensive DCF Model: Editable template featuring in-depth valuation calculations tailored for Wuxi Lead Intelligent Equipment CO.,LTD. (300450SZ).
- Real-World Data: Preloaded historical and projected financials for Wuxi Lead to facilitate thorough analysis.
- Customizable Parameters: Modify WACC, growth rates, and tax assumptions to explore various scenarios.
- Financial Statements: Complete annual and quarterly financial breakdowns for enhanced insights.
- Key Ratios: Integrated analysis for assessing profitability, efficiency, and leverage.
- Dashboard with Visual Outputs: Visuals such as charts and tables to present clear, actionable results.
Disclaimer
All information, articles, and product details provided on this website are for general informational and educational purposes only. We do not claim any ownership over, nor do we intend to infringe upon, any trademarks, copyrights, logos, brand names, or other intellectual property mentioned or depicted on this site. Such intellectual property remains the property of its respective owners, and any references here are made solely for identification or informational purposes, without implying any affiliation, endorsement, or partnership.
We make no representations or warranties, express or implied, regarding the accuracy, completeness, or suitability of any content or products presented. Nothing on this website should be construed as legal, tax, investment, financial, medical, or other professional advice. In addition, no part of this site—including articles or product references—constitutes a solicitation, recommendation, endorsement, advertisement, or offer to buy or sell any securities, franchises, or other financial instruments, particularly in jurisdictions where such activity would be unlawful.
All content is of a general nature and may not address the specific circumstances of any individual or entity. It is not a substitute for professional advice or services. Any actions you take based on the information provided here are strictly at your own risk. You accept full responsibility for any decisions or outcomes arising from your use of this website and agree to release us from any liability in connection with your use of, or reliance upon, the content or products found herein.