
|
SangFor Technologies Inc. (300454.SZ) Valation DCF |
Entièrement Modifiable: Adapté À Vos Besoins Dans Excel Ou Sheets
Conception Professionnelle: Modèles Fiables Et Conformes Aux Normes Du Secteur
Pré-Construits Pour Une Utilisation Rapide Et Efficace
Compatible MAC/PC, entièrement débloqué
Aucune Expertise N'Est Requise; Facile À Suivre
Sangfor Technologies Inc. (300454.SZ) Bundle
Vous cherchez à évaluer la valeur intrinsèque de Sangfor Technologies Inc.? Notre calculatrice DCF (300454SZ) intègre des données réelles avec des fonctionnalités de personnalisation étendues, vous permettant d'affiner vos prévisions et d'améliorer vos stratégies d'investissement.
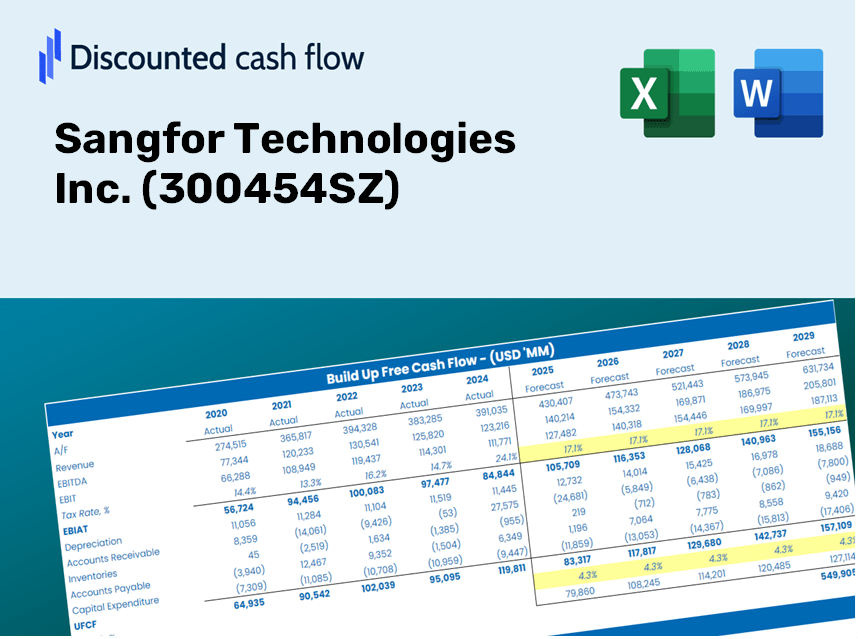
Discounted Cash Flow (DCF) - (USD MM)
| Year | AY1 2020 |
AY2 2021 |
AY3 2022 |
AY4 2023 |
AY5 2024 |
FY1 2025 |
FY2 2026 |
FY3 2027 |
FY4 2028 |
FY5 2029 |
|---|---|---|---|---|---|---|---|---|---|---|
| Revenue | 5,458.4 | 6,804.9 | 7,412.9 | 7,662.2 | 7,519.8 | 8,240.2 | 9,029.6 | 9,894.6 | 10,842.6 | 11,881.3 |
| Revenue Growth, % | 0 | 24.67 | 8.93 | 3.36 | -1.86 | 9.58 | 9.58 | 9.58 | 9.58 | 9.58 |
| EBITDA | 619.5 | 61.1 | 89.7 | 61.2 | 41.8 | 244.1 | 267.5 | 293.1 | 321.2 | 352.0 |
| EBITDA, % | 11.35 | 0.89784 | 1.21 | 0.79831 | 0.55595 | 2.96 | 2.96 | 2.96 | 2.96 | 2.96 |
| Depreciation | 133.9 | 150.3 | 186.6 | 182.1 | 190.6 | 199.2 | 218.3 | 239.2 | 262.2 | 287.3 |
| Depreciation, % | 2.45 | 2.21 | 2.52 | 2.38 | 2.53 | 2.42 | 2.42 | 2.42 | 2.42 | 2.42 |
| EBIT | 485.6 | -89.2 | -96.8 | -120.9 | -148.8 | 44.9 | 49.2 | 53.9 | 59.0 | 64.7 |
| EBIT, % | 8.9 | -1.31 | -1.31 | -1.58 | -1.98 | 0.54448 | 0.54448 | 0.54448 | 0.54448 | 0.54448 |
| Total Cash | 2,487.4 | 2,053.7 | 2,901.5 | 5,294.0 | 2,641.2 | 3,611.0 | 3,956.9 | 4,336.0 | 4,751.4 | 5,206.6 |
| Total Cash, percent | .0 | .0 | .0 | .0 | .0 | .0 | .0 | .0 | .0 | .0 |
| Account Receivables | 594.7 | 728.4 | 821.3 | 903.4 | 852.2 | 919.6 | 1,007.7 | 1,104.2 | 1,210.0 | 1,326.0 |
| Account Receivables, % | 10.89 | 10.7 | 11.08 | 11.79 | 11.33 | 11.16 | 11.16 | 11.16 | 11.16 | 11.16 |
| Inventories | 180.0 | 350.3 | 273.5 | 382.8 | 340.3 | 356.9 | 391.1 | 428.6 | 469.6 | 514.6 |
| Inventories, % | 3.3 | 5.15 | 3.69 | 5 | 4.53 | 4.33 | 4.33 | 4.33 | 4.33 | 4.33 |
| Accounts Payable | 439.1 | 407.6 | 741.3 | 975.3 | 907.1 | 804.7 | 881.8 | 966.2 | 1,058.8 | 1,160.2 |
| Accounts Payable, % | 8.04 | 5.99 | 10 | 12.73 | 12.06 | 9.77 | 9.77 | 9.77 | 9.77 | 9.77 |
| Capital Expenditure | -228.7 | -350.0 | -461.7 | -328.1 | -407.9 | -416.4 | -456.3 | -500.1 | -548.0 | -600.5 |
| Capital Expenditure, % | -4.19 | -5.14 | -6.23 | -4.28 | -5.42 | -5.05 | -5.05 | -5.05 | -5.05 | -5.05 |
| Tax Rate, % | 3.66 | 3.66 | 3.66 | 3.66 | 3.66 | 3.66 | 3.66 | 3.66 | 3.66 | 3.66 |
| EBITAT | 513.4 | -94.9 | -86.0 | -117.4 | -143.3 | 43.3 | 47.4 | 52.0 | 56.9 | 62.4 |
| Depreciation | ||||||||||
| Changes in Account Receivables | ||||||||||
| Changes in Inventories | ||||||||||
| Changes in Accounts Payable | ||||||||||
| Capital Expenditure | ||||||||||
| UFCF | 83.0 | -630.2 | -43.4 | -220.9 | -335.1 | -360.4 | -235.8 | -258.4 | -283.1 | -310.3 |
| WACC, % | 8.13 | 8.13 | 8.11 | 8.12 | 8.12 | 8.12 | 8.12 | 8.12 | 8.12 | 8.12 |
| PV UFCF | ||||||||||
| SUM PV UFCF | -1,156.6 | |||||||||
| Long Term Growth Rate, % | 4.00 | |||||||||
| Free cash flow (T + 1) | -323 | |||||||||
| Terminal Value | -7,826 | |||||||||
| Present Terminal Value | -5,296 | |||||||||
| Enterprise Value | -6,453 | |||||||||
| Net Debt | 879 | |||||||||
| Equity Value | -7,332 | |||||||||
| Diluted Shares Outstanding, MM | 419 | |||||||||
| Equity Value Per Share | -17.50 |
Benefits You Will Receive
- Genuine SANGFOR Financial Data: Access to both historical and projected data for precise valuation.
- Customizable Parameters: Adjust WACC, tax rates, revenue growth, and capital expenditures as needed.
- Real-Time Calculations: Automatically calculates intrinsic value and NPV on the fly.
- Comprehensive Scenario Analysis: Evaluate multiple scenarios to assess the future performance of Sangfor Technologies Inc. (300454SZ).
- User-Friendly and Professional Design: Created for experts, yet easy to navigate for newcomers.
Key Features
- Accurate Historical Data: Pre-loaded with Sangfor Technologies Inc.’s historical financial metrics and future projections.
- Customizable Parameters: Modify revenue growth rates, profit margins, WACC, tax rates, and capital expenditures to suit your analysis.
- Interactive Valuation Model: Automatically recalculates Net Present Value (NPV) and intrinsic value based on your customized inputs.
- Scenario Analysis: Develop various forecasting scenarios to evaluate different valuation possibilities.
- Intuitive User Interface: Designed to be accessible and straightforward for both professionals and newcomers.
How It Functions
- Step 1: Download the prebuilt Excel template featuring Sangfor Technologies Inc. data.
- Step 2: Navigate through the pre-filled sheets to familiarize yourself with the essential metrics.
- Step 3: Adjust forecasts and assumptions in the editable yellow cells (WACC, growth, margins).
- Step 4: Immediately see the recalculated results, including Sangfor Technologies Inc.'s intrinsic value.
- Step 5: Use the outputs to make well-informed investment decisions or to create detailed reports.
Why Opt for Sangfor Technologies Inc. (300454SZ) Calculator?
- Precision: Leverages the latest financial data from Sangfor for reliable results.
- Versatility: Crafted for users to easily adjust and experiment with various inputs.
- Efficiency: Eliminate the need to create a DCF model from the ground up.
- Expert Quality: Built with the meticulous attention to detail of top-level financial professionals.
- User-Centric: Designed to be intuitive, making it accessible for those with minimal financial modeling skills.
Who Should Utilize This Product?
- Investors: Accurately determine the fair value of Sangfor Technologies Inc. (300454SZ) before making investment choices.
- CFOs: Utilize a high-grade DCF model for financial reporting and in-depth analysis.
- Consultants: Seamlessly customize the template for client valuation reports.
- Entrepreneurs: Gain valuable insights into financial modeling practices of leading technology companies.
- Educators: Employ it as a teaching resource to illustrate various valuation techniques.
Contents of the Template
- Pre-Filled DCF Model: Sangfor Technologies Inc.'s (300454SZ) financial data preloaded for immediate application.
- WACC Calculator: Comprehensive calculations for the Weighted Average Cost of Capital.
- Financial Ratios: Analyze Sangfor Technologies Inc.'s (300454SZ) profitability, leverage, and efficiency metrics.
- Editable Inputs: Modify assumptions such as growth rates, margins, and CAPEX to tailor your analysis.
- Financial Statements: Access annual and quarterly reports to facilitate in-depth analysis.
- Interactive Dashboard: Effortlessly visualize key valuation metrics and outcomes.
Disclaimer
All information, articles, and product details provided on this website are for general informational and educational purposes only. We do not claim any ownership over, nor do we intend to infringe upon, any trademarks, copyrights, logos, brand names, or other intellectual property mentioned or depicted on this site. Such intellectual property remains the property of its respective owners, and any references here are made solely for identification or informational purposes, without implying any affiliation, endorsement, or partnership.
We make no representations or warranties, express or implied, regarding the accuracy, completeness, or suitability of any content or products presented. Nothing on this website should be construed as legal, tax, investment, financial, medical, or other professional advice. In addition, no part of this site—including articles or product references—constitutes a solicitation, recommendation, endorsement, advertisement, or offer to buy or sell any securities, franchises, or other financial instruments, particularly in jurisdictions where such activity would be unlawful.
All content is of a general nature and may not address the specific circumstances of any individual or entity. It is not a substitute for professional advice or services. Any actions you take based on the information provided here are strictly at your own risk. You accept full responsibility for any decisions or outcomes arising from your use of this website and agree to release us from any liability in connection with your use of, or reliance upon, the content or products found herein.