
|
Zhejiang Jinke Tom Culture Industry Co., Ltd. (300459.sz) Évaluation DCF |
Entièrement Modifiable: Adapté À Vos Besoins Dans Excel Ou Sheets
Conception Professionnelle: Modèles Fiables Et Conformes Aux Normes Du Secteur
Pré-Construits Pour Une Utilisation Rapide Et Efficace
Compatible MAC/PC, entièrement débloqué
Aucune Expertise N'Est Requise; Facile À Suivre
Zhejiang Jinke Tom Culture Industry Co., LTD. (300459.SZ) Bundle
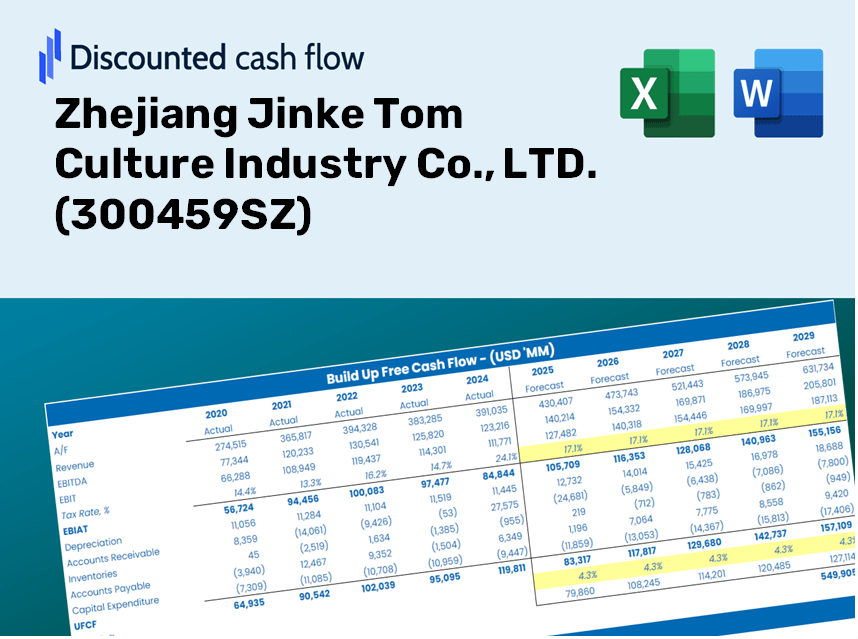
Optimisez votre temps et améliorez la précision avec notre calculatrice DCF (300459SZ)! Utilisation de données réelles de Zhejiang Jinke Tom Culture Industry Co., Ltd. Et des hypothèses personnalisables, cet outil vous permet de prévoir, analyser et valoriser (300459SZ) comme un investisseur chevronné.
Discounted Cash Flow (DCF) - (USD MM)
| Year | AY1 2020 |
AY2 2021 |
AY3 2022 |
AY4 2023 |
AY5 2024 |
FY1 2025 |
FY2 2026 |
FY3 2027 |
FY4 2028 |
FY5 2029 |
|---|---|---|---|---|---|---|---|---|---|---|
| Revenue | 1,807.2 | 1,941.5 | 1,632.9 | 1,347.7 | 1,143.1 | 1,025.6 | 920.2 | 825.6 | 740.7 | 664.6 |
| Revenue Growth, % | 0 | 7.43 | -15.89 | -17.46 | -15.18 | -10.28 | -10.28 | -10.28 | -10.28 | -10.28 |
| EBITDA | 1,102.0 | 1,027.9 | 707.2 | -534.7 | -576.5 | 137.7 | 123.5 | 110.8 | 99.4 | 89.2 |
| EBITDA, % | 60.98 | 52.94 | 43.31 | -39.67 | -50.43 | 13.43 | 13.43 | 13.43 | 13.43 | 13.43 |
| Depreciation | 161.7 | 154.8 | 138.6 | 147.3 | 122.7 | 96.6 | 86.6 | 77.7 | 69.7 | 62.6 |
| Depreciation, % | 8.95 | 7.97 | 8.49 | 10.93 | 10.73 | 9.41 | 9.41 | 9.41 | 9.41 | 9.41 |
| EBIT | 940.3 | 873.1 | 568.6 | -682.0 | -699.2 | 41.1 | 36.9 | 33.1 | 29.7 | 26.7 |
| EBIT, % | 52.03 | 44.97 | 34.82 | -50.6 | -61.16 | 4.01 | 4.01 | 4.01 | 4.01 | 4.01 |
| Total Cash | 712.3 | 884.9 | 623.2 | 338.3 | 364.5 | 369.5 | 331.5 | 297.5 | 266.9 | 239.5 |
| Total Cash, percent | .0 | .0 | .0 | .0 | .0 | .0 | .0 | .0 | .0 | .0 |
| Account Receivables | 237.9 | 207.9 | 221.4 | 381.2 | 164.9 | 164.4 | 147.5 | 132.3 | 118.7 | 106.5 |
| Account Receivables, % | 13.16 | 10.71 | 13.56 | 28.29 | 14.43 | 16.03 | 16.03 | 16.03 | 16.03 | 16.03 |
| Inventories | 4.6 | 5.4 | 4.2 | 4.8 | 6.2 | 3.5 | 3.1 | 2.8 | 2.5 | 2.2 |
| Inventories, % | 0.25514 | 0.27621 | 0.25451 | 0.35353 | 0.54589 | 0.33706 | 0.33706 | 0.33706 | 0.33706 | 0.33706 |
| Accounts Payable | 61.8 | 90.7 | 93.3 | 67.7 | 72.1 | 51.5 | 46.2 | 41.5 | 37.2 | 33.4 |
| Accounts Payable, % | 3.42 | 4.67 | 5.71 | 5.02 | 6.3 | 5.03 | 5.03 | 5.03 | 5.03 | 5.03 |
| Capital Expenditure | -172.5 | -139.2 | -88.8 | -250.0 | -138.4 | -108.3 | -97.2 | -87.2 | -78.2 | -70.2 |
| Capital Expenditure, % | -9.55 | -7.17 | -5.44 | -18.55 | -12.11 | -10.56 | -10.56 | -10.56 | -10.56 | -10.56 |
| Tax Rate, % | -5.32 | -5.32 | -5.32 | -5.32 | -5.32 | -5.32 | -5.32 | -5.32 | -5.32 | -5.32 |
| EBITAT | 916.8 | 823.9 | 539.3 | -741.0 | -736.4 | 40.0 | 35.9 | 32.2 | 28.9 | 25.9 |
| Depreciation | ||||||||||
| Changes in Account Receivables | ||||||||||
| Changes in Inventories | ||||||||||
| Changes in Accounts Payable | ||||||||||
| Capital Expenditure | ||||||||||
| UFCF | 725.2 | 897.7 | 579.5 | -1,029.8 | -533.0 | 11.1 | 37.3 | 33.5 | 30.0 | 26.9 |
| WACC, % | 6.22 | 6.2 | 6.21 | 6.24 | 6.24 | 6.22 | 6.22 | 6.22 | 6.22 | 6.22 |
| PV UFCF | ||||||||||
| SUM PV UFCF | 114.9 | |||||||||
| Long Term Growth Rate, % | 3.50 | |||||||||
| Free cash flow (T + 1) | 28 | |||||||||
| Terminal Value | 1,025 | |||||||||
| Present Terminal Value | 758 | |||||||||
| Enterprise Value | 873 | |||||||||
| Net Debt | 849 | |||||||||
| Equity Value | 24 | |||||||||
| Diluted Shares Outstanding, MM | 3,580 | |||||||||
| Equity Value Per Share | 0.01 |
What You Will Receive
- Customizable Excel Template: A fully adaptable Excel-based DCF Calculator featuring the latest financial data for Zhejiang Jinke Tom Culture Industry Co., LTD. (300459SZ).
- Comprehensive Data: Access to historical figures and future projections (highlighted in the yellow cells).
- Flexible Forecasting: Modify forecast parameters such as revenue growth, EBITDA margin, and WACC.
- Instant Calculations: Quickly assess how your inputs influence the valuation of Zhejiang Jinke Tom Culture Industry Co., LTD. (300459SZ).
- Professional Resource: Designed for investors, CFOs, consultants, and financial analysts.
- Intuitive Layout: Organized for clarity and straightforward navigation, complete with step-by-step guidance.
Core Features
- Comprehensive Jinke Financials: Gain access to reliable pre-loaded historical data and future forecasts for Zhejiang Jinke Tom Culture Industry Co., LTD. (300459SZ).
- Adjustable Forecast Parameters: Modify highlighted cells, such as WACC, growth rates, and profit margins to suit your analysis.
- Real-Time Calculations: Automatic recalculations for DCF, Net Present Value (NPV), and cash flow assessments.
- User-Friendly Dashboard: Intuitive charts and summaries for a clear visualization of your valuation outcomes.
- Designed for All Skill Levels: A streamlined and easy-to-navigate layout tailored for investors, CFOs, and consultants.
How It Works
- Step 1: Download the prebuilt Excel template featuring data for Zhejiang Jinke Tom Culture Industry Co., LTD. (300459SZ).
- Step 2: Review the pre-filled sheets to familiarize yourself with the essential metrics.
- Step 3: Adjust forecasts and assumptions in the editable yellow cells (WACC, growth, margins).
- Step 4: Instantly see updated results, including the intrinsic value of Zhejiang Jinke Tom Culture Industry Co., LTD. (300459SZ).
- Step 5: Use the outputs to make informed investment choices or create detailed reports.
Why Opt for This Calculator?
- Precise Information: Authentic financial data from Zhejiang Jinke Tom Culture Industry Co., LTD. guarantees trustworthy valuation outcomes.
- Tailorable: Modify essential factors such as growth projections, WACC, and tax rates to align with your forecasts.
- Efficient: Ready-made calculations save time and eliminate the hassle of starting from the ground up.
- Professional-Quality Tool: Created for investors, analysts, and industry experts.
- User-Friendly: Simple design and guided instructions ensure accessibility for all users.
Who Can Benefit from This Product?
- Investors: Evaluate the valuation of Zhejiang Jinke Tom Culture Industry Co., LTD. (300459SZ) before making stock transactions.
- CFOs and Financial Analysts: Optimize valuation processes and assess financial forecasts.
- Startup Founders: Understand how leading public companies like Zhejiang Jinke Tom Culture Industry Co., LTD. (300459SZ) are valued.
- Consultants: Create detailed valuation reports for your clients.
- Students and Educators: Utilize real-life data to practice and teach valuation methodologies.
Contents of the Template
- Pre-Filled DCF Model: Zhejiang Jinke Tom Culture Industry Co., LTD.'s financial data preloaded for immediate application.
- WACC Calculator: Comprehensive calculations for the Weighted Average Cost of Capital.
- Financial Ratios: Assess the company's profitability, leverage, and operational efficiency.
- Editable Inputs: Modify assumptions such as growth rates, profit margins, and CAPEX to suit your analysis.
- Financial Statements: Access annual and quarterly reports for in-depth evaluation.
- Interactive Dashboard: Effortlessly visualize essential valuation metrics and outcomes.
Disclaimer
All information, articles, and product details provided on this website are for general informational and educational purposes only. We do not claim any ownership over, nor do we intend to infringe upon, any trademarks, copyrights, logos, brand names, or other intellectual property mentioned or depicted on this site. Such intellectual property remains the property of its respective owners, and any references here are made solely for identification or informational purposes, without implying any affiliation, endorsement, or partnership.
We make no representations or warranties, express or implied, regarding the accuracy, completeness, or suitability of any content or products presented. Nothing on this website should be construed as legal, tax, investment, financial, medical, or other professional advice. In addition, no part of this site—including articles or product references—constitutes a solicitation, recommendation, endorsement, advertisement, or offer to buy or sell any securities, franchises, or other financial instruments, particularly in jurisdictions where such activity would be unlawful.
All content is of a general nature and may not address the specific circumstances of any individual or entity. It is not a substitute for professional advice or services. Any actions you take based on the information provided here are strictly at your own risk. You accept full responsibility for any decisions or outcomes arising from your use of this website and agree to release us from any liability in connection with your use of, or reliance upon, the content or products found herein.