
|
Optics Technology Holding Co., Ltd (300489.SZ) Évaluation DCF |
Entièrement Modifiable: Adapté À Vos Besoins Dans Excel Ou Sheets
Conception Professionnelle: Modèles Fiables Et Conformes Aux Normes Du Secteur
Pré-Construits Pour Une Utilisation Rapide Et Efficace
Compatible MAC/PC, entièrement débloqué
Aucune Expertise N'Est Requise; Facile À Suivre
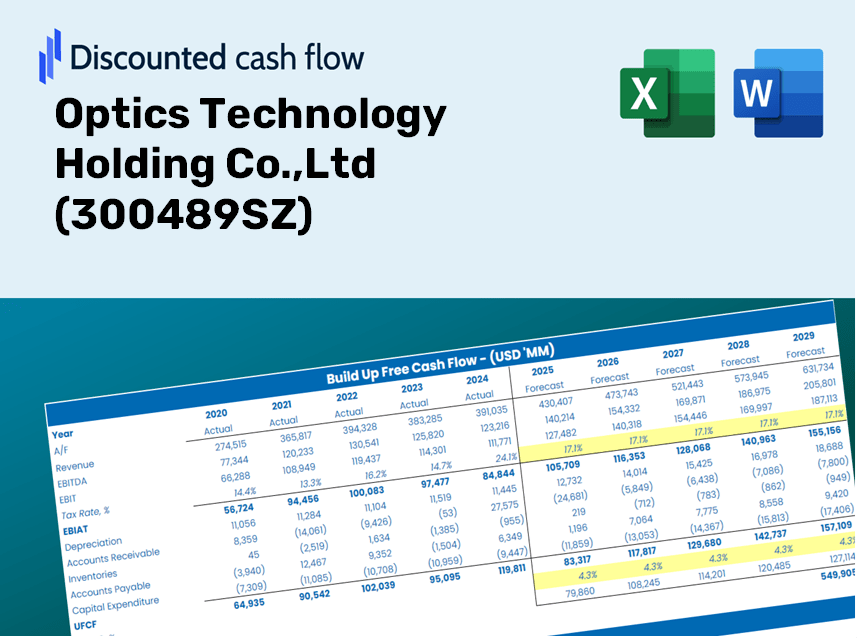
Optics Technology Holding Co.,Ltd (300489.SZ) Bundle
Améliorez vos choix d'investissement avec la calculatrice DCF (300489SZ)! Explorez de véritables données financières d'Optics Technology Holding Co., Ltd, ajustez les prédictions et les dépenses de croissance et observez instantanément comment ces modifications affectent la valeur intrinsèque de (300489SZ).
What You Will Receive
- Accurate (300489SZ) Financial Data: Pre-loaded with historical and forecasted information for precise evaluations.
- Completely Customizable Template: Easily adjust key inputs such as revenue growth rate, WACC, and EBITDA percentage.
- Real-Time Calculations: Watch (300489SZ) intrinsic value update automatically as you make adjustments.
- Expert Valuation Tool: Tailored for investors, analysts, and consultants who require reliable DCF outputs.
- Intuitive User Interface: A straightforward layout and clear guidance suitable for all skill levels.
Key Features
- Comprehensive Financial Data: Access Optics Technology Holding Co., Ltd's historical financial statements along with pre-set forecasts.
- Customizable Inputs: Adjust parameters such as WACC, tax rates, revenue growth, and EBITDA margins to fit your analysis.
- Real-Time Calculations: Watch the intrinsic value of Optics Technology Holding Co., Ltd. (300489SZ) update instantly.
- Intuitive Visual Reporting: Dashboard charts provide a clear view of valuation outcomes and essential metrics.
- Engineered for Precision: A reliable tool tailored for analysts, investors, and finance professionals.
How It Functions
- Download: Obtain the pre-configured Excel file containing financial data for Optics Technology Holding Co., Ltd (300489SZ).
- Customize: Tailor your forecasts, including revenue growth, EBITDA %, and WACC estimates.
- Automatic Updates: The intrinsic value and NPV calculations refresh in real-time.
- Scenario Testing: Generate various projections and instantly compare their outcomes.
- Informed Decisions: Leverage the valuation results to inform your investment strategy.
Why Opt for This Calculator for Optics Technology Holding Co., Ltd (300489SZ)?
- All-in-One Solution: Combines DCF, WACC, and financial ratio analyses seamlessly.
- Flexible Inputs: Modify the highlighted cells to explore different scenarios.
- In-Depth Analysis: Automatically computes the intrinsic value and Net Present Value for Optics Technology.
- Built-in Data: Features historical and projected data for precise calculations.
- High-Quality Standards: Perfect for financial analysts, investors, and business consultants.
Who Can Benefit from This Product?
- Investors: Evaluate the valuation of Optics Technology Holding Co., Ltd (300489SZ) before making investment decisions.
- CFOs and Financial Analysts: Optimize valuation workflows and validate financial projections.
- Startup Founders: Gain insights into how established companies like Optics Technology are valued.
- Consultants: Create comprehensive valuation reports for your clients.
- Students and Educators: Utilize real market data to practice and teach valuation methods.
Contents of the Template
- In-Depth DCF Model: Editable framework featuring detailed valuation assessments.
- Market Data: Optics Technology Holding Co., Ltd's historical and projected financial figures preloaded for analysis.
- Adjustable Parameters: Modify WACC, growth rates, and tax assumptions to explore various scenarios.
- Financial Statements: Comprehensive annual and quarterly financial breakdowns for deeper insights.
- Key Ratios: Built-in metrics for analyzing profitability, efficiency, and leverage.
- Dashboard with Visual Outputs: Graphs and tables providing clear, actionable results.
Disclaimer
All information, articles, and product details provided on this website are for general informational and educational purposes only. We do not claim any ownership over, nor do we intend to infringe upon, any trademarks, copyrights, logos, brand names, or other intellectual property mentioned or depicted on this site. Such intellectual property remains the property of its respective owners, and any references here are made solely for identification or informational purposes, without implying any affiliation, endorsement, or partnership.
We make no representations or warranties, express or implied, regarding the accuracy, completeness, or suitability of any content or products presented. Nothing on this website should be construed as legal, tax, investment, financial, medical, or other professional advice. In addition, no part of this site—including articles or product references—constitutes a solicitation, recommendation, endorsement, advertisement, or offer to buy or sell any securities, franchises, or other financial instruments, particularly in jurisdictions where such activity would be unlawful.
All content is of a general nature and may not address the specific circumstances of any individual or entity. It is not a substitute for professional advice or services. Any actions you take based on the information provided here are strictly at your own risk. You accept full responsibility for any decisions or outcomes arising from your use of this website and agree to release us from any liability in connection with your use of, or reliance upon, the content or products found herein.