
|
Thunder Software Technology Co., Ltd. (300496.SZ) Évaluation DCF |
Entièrement Modifiable: Adapté À Vos Besoins Dans Excel Ou Sheets
Conception Professionnelle: Modèles Fiables Et Conformes Aux Normes Du Secteur
Pré-Construits Pour Une Utilisation Rapide Et Efficace
Compatible MAC/PC, entièrement débloqué
Aucune Expertise N'Est Requise; Facile À Suivre
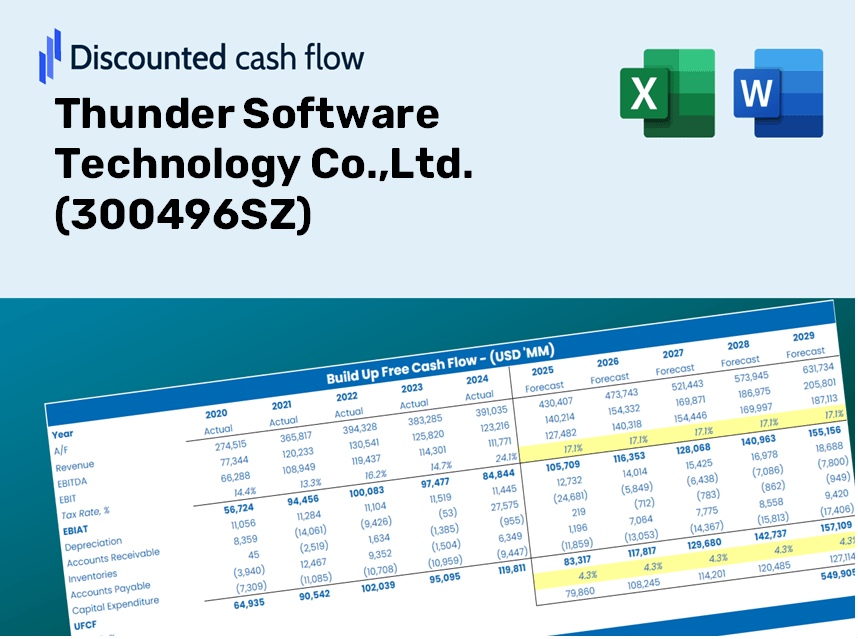
Thunder Software Technology Co.,Ltd. (300496.SZ) Bundle
Explorez Thunder Software Technology Co., Ltd. (300496SZ) Prospects financiers avec notre calculatrice DCF conviviale! Entrez vos hypothèses pour la croissance, les marges et les coûts pour calculer la valeur intrinsèque de Thunder Software Technology Co., Ltd. (300496SZ) et améliorez votre stratégie d'investissement.
Discounted Cash Flow (DCF) - (USD MM)
| Year | AY1 2020 |
AY2 2021 |
AY3 2022 |
AY4 2023 |
AY5 2024 |
FY1 2025 |
FY2 2026 |
FY3 2027 |
FY4 2028 |
FY5 2029 |
|---|---|---|---|---|---|---|---|---|---|---|
| Revenue | 2,627.9 | 4,126.7 | 5,445.5 | 5,242.2 | 5,384.6 | 6,568.9 | 8,013.7 | 9,776.3 | 11,926.5 | 14,549.6 |
| Revenue Growth, % | 0 | 57.04 | 31.96 | -3.73 | 2.72 | 21.99 | 21.99 | 21.99 | 21.99 | 21.99 |
| EBITDA | 589.9 | 811.2 | 1,033.8 | 791.5 | 850.7 | 1,208.5 | 1,474.3 | 1,798.6 | 2,194.1 | 2,676.7 |
| EBITDA, % | 22.45 | 19.66 | 18.98 | 15.1 | 15.8 | 18.4 | 18.4 | 18.4 | 18.4 | 18.4 |
| Depreciation | 108.0 | 149.5 | 251.4 | 365.1 | 401.7 | 351.8 | 429.1 | 523.5 | 638.6 | 779.1 |
| Depreciation, % | 4.11 | 3.62 | 4.62 | 6.96 | 7.46 | 5.35 | 5.35 | 5.35 | 5.35 | 5.35 |
| EBIT | 481.9 | 661.7 | 782.5 | 426.4 | 448.9 | 856.7 | 1,045.2 | 1,275.1 | 1,555.5 | 1,897.6 |
| EBIT, % | 18.34 | 16.03 | 14.37 | 8.13 | 8.34 | 13.04 | 13.04 | 13.04 | 13.04 | 13.04 |
| Total Cash | 2,087.3 | 2,116.7 | 4,667.3 | 4,627.0 | 3,184.9 | 4,780.1 | 5,831.5 | 7,114.0 | 8,678.7 | 10,587.5 |
| Total Cash, percent | .0 | .0 | .0 | .0 | .0 | .0 | .0 | .0 | .0 | .0 |
| Account Receivables | 801.9 | 1,293.6 | 1,810.2 | 1,942.7 | 2,505.5 | 2,347.6 | 2,864.0 | 3,493.9 | 4,262.3 | 5,199.8 |
| Account Receivables, % | 30.52 | 31.35 | 33.24 | 37.06 | 46.53 | 35.74 | 35.74 | 35.74 | 35.74 | 35.74 |
| Inventories | 400.5 | 714.7 | 850.5 | 844.5 | 850.4 | 1,052.1 | 1,283.5 | 1,565.7 | 1,910.1 | 2,330.2 |
| Inventories, % | 15.24 | 17.32 | 15.62 | 16.11 | 15.79 | 16.02 | 16.02 | 16.02 | 16.02 | 16.02 |
| Accounts Payable | 152.4 | 295.3 | 330.0 | 334.2 | 976.6 | 571.8 | 697.6 | 851.1 | 1,038.2 | 1,266.6 |
| Accounts Payable, % | 5.8 | 7.16 | 6.06 | 6.38 | 18.14 | 8.71 | 8.71 | 8.71 | 8.71 | 8.71 |
| Capital Expenditure | -405.8 | -462.0 | -515.5 | -445.8 | -1,044.6 | -840.9 | -1,025.9 | -1,251.5 | -1,526.7 | -1,862.5 |
| Capital Expenditure, % | -15.44 | -11.19 | -9.47 | -8.5 | -19.4 | -12.8 | -12.8 | -12.8 | -12.8 | -12.8 |
| Tax Rate, % | 7.53 | 7.53 | 7.53 | 7.53 | 7.53 | 7.53 | 7.53 | 7.53 | 7.53 | 7.53 |
| EBITAT | 462.5 | 666.8 | 786.9 | 469.1 | 415.1 | 836.9 | 1,021.0 | 1,245.6 | 1,519.5 | 1,853.7 |
| Depreciation | ||||||||||
| Changes in Account Receivables | ||||||||||
| Changes in Inventories | ||||||||||
| Changes in Accounts Payable | ||||||||||
| Capital Expenditure | ||||||||||
| UFCF | -885.3 | -308.6 | -95.0 | 266.2 | -154.2 | -100.7 | -197.7 | -241.2 | -294.2 | -358.9 |
| WACC, % | 9.77 | 9.77 | 9.77 | 9.77 | 9.77 | 9.77 | 9.77 | 9.77 | 9.77 | 9.77 |
| PV UFCF | ||||||||||
| SUM PV UFCF | -865.9 | |||||||||
| Long Term Growth Rate, % | 3.50 | |||||||||
| Free cash flow (T + 1) | -371 | |||||||||
| Terminal Value | -5,922 | |||||||||
| Present Terminal Value | -3,716 | |||||||||
| Enterprise Value | -4,582 | |||||||||
| Net Debt | -3,109 | |||||||||
| Equity Value | -1,472 | |||||||||
| Diluted Shares Outstanding, MM | 461 | |||||||||
| Equity Value Per Share | -3.19 |
What You Will Receive
- Authentic 300496SZ Financials: Comprises both historical and projected data for precise valuation.
- Customizable Inputs: Adjust parameters such as WACC, tax rates, revenue growth, and capital expenditures.
- Automated Calculations: Intrinsic value and NPV are computed in real-time.
- Scenario Analysis: Explore various scenarios to assess Thunder Software Technology's future performance.
- User-Friendly Design: Designed for industry professionals while remaining accessible to newcomers.
Core Features
- Comprehensive Financial Data: Gain access to precise historical data and forward-looking projections for Thunder Software Technology Co.,Ltd. (300496SZ).
- Adjustable Forecast Parameters: Modify highlighted cells for metrics such as WACC, growth rates, and profit margins.
- Automated Calculations: Enjoy real-time updates for DCF, Net Present Value (NPV), and cash flow assessments.
- Interactive Dashboard: Visualize your valuation outcomes with clear charts and summary displays.
- Designed for All Users: An intuitive layout tailored for investors, CFOs, and consultants, whether novice or expert.
How It Works
- Step 1: Download the Excel file.
- Step 2: Review the pre-filled data for Thunder Software Technology Co., Ltd. (300496SZ) (historical and projected).
- Step 3: Modify the key assumptions (highlighted in yellow) according to your analysis.
- Step 4: Observe the automatic recalculations for Thunder Software Technology Co., Ltd.’s (300496SZ) intrinsic value.
- Step 5: Utilize the results for investment decisions or reporting purposes.
Why Choose Thunder Software Technology Co., Ltd. (300496SZ)?
- Time Efficient: Skip the hassle of building a model from the ground up – it’s all set for you.
- Enhanced Accuracy: Dependable financial data and formulas minimize valuation errors.
- Completely Customizable: Adjust the model to align with your specific assumptions and forecasts.
- User-Friendly: Intuitive charts and outputs facilitate straightforward analysis of the results.
- Endorsed by Professionals: Crafted for industry experts who prioritize both precision and efficiency.
Who Can Benefit from Thunder Software Technology Co.,Ltd. ([300496SZ])?
- Finance Students: Master valuation techniques and apply them to real-world data.
- Researchers: Integrate industry-standard models into your studies or projects.
- Investors: Validate your hypotheses and evaluate valuation results for Thunder Software Technology Co.,Ltd. ([300496SZ]).
- Analysts: Enhance your efficiency with a tailored DCF model that's ready to use.
- Entrepreneurs: Discover how major tech firms like Thunder Software Technology Co.,Ltd. ([300496SZ]) are evaluated.
Contents of the Template
- Comprehensive DCF Model: Fully editable template featuring detailed valuation calculations.
- Real-World Data: Thunder Software Technology Co., Ltd.'s (300496SZ) historical and projected financial data preloaded for your analysis.
- Customizable Parameters: Modify WACC, growth rates, and tax assumptions to explore various scenarios.
- Financial Statements: Complete annual and quarterly breakdowns for in-depth insights.
- Key Ratios: Integrated analysis for profitability, efficiency, and financial leverage.
- Dashboard with Visual Outputs: Dynamic charts and tables providing clear, actionable conclusions.
Disclaimer
All information, articles, and product details provided on this website are for general informational and educational purposes only. We do not claim any ownership over, nor do we intend to infringe upon, any trademarks, copyrights, logos, brand names, or other intellectual property mentioned or depicted on this site. Such intellectual property remains the property of its respective owners, and any references here are made solely for identification or informational purposes, without implying any affiliation, endorsement, or partnership.
We make no representations or warranties, express or implied, regarding the accuracy, completeness, or suitability of any content or products presented. Nothing on this website should be construed as legal, tax, investment, financial, medical, or other professional advice. In addition, no part of this site—including articles or product references—constitutes a solicitation, recommendation, endorsement, advertisement, or offer to buy or sell any securities, franchises, or other financial instruments, particularly in jurisdictions where such activity would be unlawful.
All content is of a general nature and may not address the specific circumstances of any individual or entity. It is not a substitute for professional advice or services. Any actions you take based on the information provided here are strictly at your own risk. You accept full responsibility for any decisions or outcomes arising from your use of this website and agree to release us from any liability in connection with your use of, or reliance upon, the content or products found herein.