
|
Guangzhou Haozhi Industrial Co., Ltd. (300503.SZ) Évaluation DCF |
Entièrement Modifiable: Adapté À Vos Besoins Dans Excel Ou Sheets
Conception Professionnelle: Modèles Fiables Et Conformes Aux Normes Du Secteur
Pré-Construits Pour Une Utilisation Rapide Et Efficace
Compatible MAC/PC, entièrement débloqué
Aucune Expertise N'Est Requise; Facile À Suivre
Guangzhou Haozhi Industrial Co.,Ltd. (300503.SZ) Bundle
En tant qu'investisseur ou analyste, la calculatrice DCF [300503SZ] est votre ressource incontournable pour une évaluation précise. Avec de vraies données de Guangzhou Haozhi Industrial Co., Ltd., vous pouvez facilement ajuster les prévisions et observer les effets en temps réel.
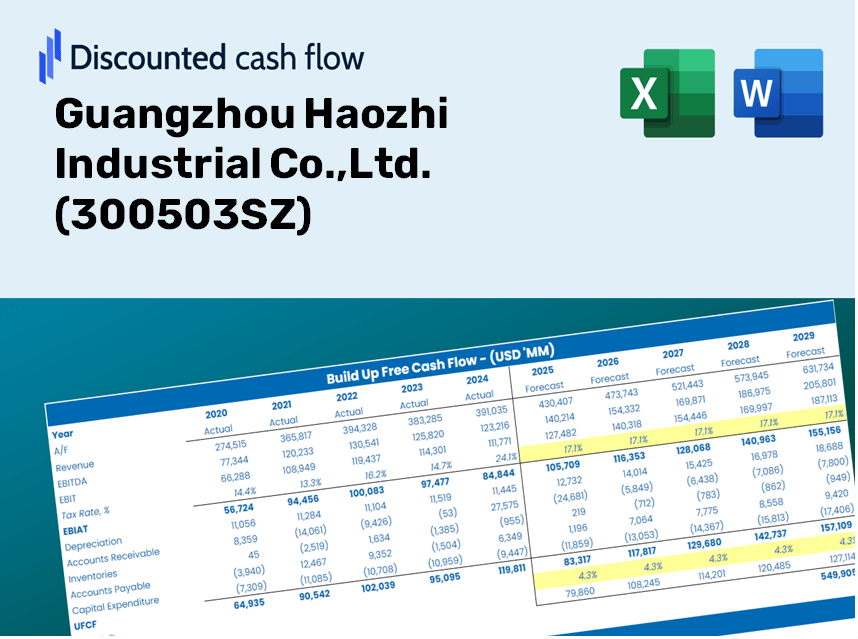
Discounted Cash Flow (DCF) - (USD MM)
| Year | AY1 2020 |
AY2 2021 |
AY3 2022 |
AY4 2023 |
AY5 2024 |
FY1 2025 |
FY2 2026 |
FY3 2027 |
FY4 2028 |
FY5 2029 |
|---|---|---|---|---|---|---|---|---|---|---|
| Revenue | 874.4 | 1,140.3 | 964.9 | 1,000.3 | 1,306.7 | 1,467.8 | 1,648.9 | 1,852.2 | 2,080.6 | 2,337.2 |
| Revenue Growth, % | 0 | 30.41 | -15.38 | 3.66 | 30.63 | 12.33 | 12.33 | 12.33 | 12.33 | 12.33 |
| EBITDA | 168.2 | 246.7 | 121.0 | 52.9 | 214.9 | 220.6 | 247.8 | 278.4 | 312.7 | 351.3 |
| EBITDA, % | 19.24 | 21.64 | 12.54 | 5.29 | 16.44 | 15.03 | 15.03 | 15.03 | 15.03 | 15.03 |
| Depreciation | 74.4 | 74.8 | 78.0 | 106.4 | 108.7 | 123.6 | 138.8 | 155.9 | 175.2 | 196.8 |
| Depreciation, % | 8.51 | 6.56 | 8.08 | 10.63 | 8.32 | 8.42 | 8.42 | 8.42 | 8.42 | 8.42 |
| EBIT | 93.8 | 171.9 | 43.1 | -53.5 | 106.2 | 97.0 | 109.0 | 122.4 | 137.5 | 154.5 |
| EBIT, % | 10.73 | 15.08 | 4.46 | -5.35 | 8.13 | 6.61 | 6.61 | 6.61 | 6.61 | 6.61 |
| Total Cash | 131.0 | 263.8 | 171.1 | 84.6 | 77.6 | 206.3 | 231.7 | 260.3 | 292.4 | 328.4 |
| Total Cash, percent | .0 | .0 | .0 | .0 | .0 | .0 | .0 | .0 | .0 | .0 |
| Account Receivables | 417.5 | 554.3 | 513.6 | 516.6 | 740.2 | 757.1 | 850.4 | 955.3 | 1,073.1 | 1,205.4 |
| Account Receivables, % | 47.75 | 48.61 | 53.23 | 51.65 | 56.64 | 51.58 | 51.58 | 51.58 | 51.58 | 51.58 |
| Inventories | 377.6 | 489.1 | 519.0 | 476.8 | 485.6 | 659.6 | 741.0 | 832.4 | 935.0 | 1,050.3 |
| Inventories, % | 43.19 | 42.89 | 53.79 | 47.67 | 37.16 | 44.94 | 44.94 | 44.94 | 44.94 | 44.94 |
| Accounts Payable | 108.1 | 197.1 | 144.9 | 176.0 | 271.1 | 243.7 | 273.8 | 307.5 | 345.5 | 388.1 |
| Accounts Payable, % | 12.37 | 17.29 | 15.02 | 17.6 | 20.75 | 16.6 | 16.6 | 16.6 | 16.6 | 16.6 |
| Capital Expenditure | -148.3 | -241.9 | -226.4 | -129.7 | -111.4 | -244.0 | -274.1 | -307.9 | -345.9 | -388.5 |
| Capital Expenditure, % | -16.96 | -21.21 | -23.46 | -12.96 | -8.53 | -16.62 | -16.62 | -16.62 | -16.62 | -16.62 |
| Tax Rate, % | 12.01 | 12.01 | 12.01 | 12.01 | 12.01 | 12.01 | 12.01 | 12.01 | 12.01 | 12.01 |
| EBITAT | 77.7 | 143.5 | 46.8 | -49.1 | 93.4 | 86.6 | 97.2 | 109.2 | 122.7 | 137.8 |
| Depreciation | ||||||||||
| Changes in Account Receivables | ||||||||||
| Changes in Inventories | ||||||||||
| Changes in Accounts Payable | ||||||||||
| Capital Expenditure | ||||||||||
| UFCF | -683.2 | -182.8 | -143.1 | -2.0 | -46.6 | -252.2 | -182.7 | -205.2 | -230.6 | -259.0 |
| WACC, % | 8.61 | 8.62 | 8.69 | 8.65 | 8.64 | 8.64 | 8.64 | 8.64 | 8.64 | 8.64 |
| PV UFCF | ||||||||||
| SUM PV UFCF | -883.6 | |||||||||
| Long Term Growth Rate, % | 4.00 | |||||||||
| Free cash flow (T + 1) | -269 | |||||||||
| Terminal Value | -5,803 | |||||||||
| Present Terminal Value | -3,834 | |||||||||
| Enterprise Value | -4,718 | |||||||||
| Net Debt | 518 | |||||||||
| Equity Value | -5,235 | |||||||||
| Diluted Shares Outstanding, MM | 307 | |||||||||
| Equity Value Per Share | -17.05 |
Benefits You Will Receive
- Authentic 300503SZ Financial Data: Access historical and projected figures for precise valuation.
- Customizable Inputs: Adjust parameters such as WACC, tax rates, revenue growth, and capital investments.
- Dynamic Calculations: Intrinsic value and NPV calculations update automatically.
- Scenario Testing: Evaluate various scenarios to assess the future performance of Guangzhou Haozhi Industrial Co., Ltd.
- User-Friendly and Professional Design: Crafted for industry experts while remaining accessible for newcomers.
Key Features
- Comprehensive AAPL Data: Pre-loaded with Guangzhou Haozhi Industrial Co., Ltd.'s historical performance and future financial outlooks.
- Customizable Parameters: Modify forecasts for revenue growth, profit margins, discount rates, tax rates, and capital investments.
- Interactive Valuation Model: Real-time updates to Net Present Value (NPV) and intrinsic value based on your adjustments.
- Scenario Simulation: Generate various forecasting scenarios to evaluate distinct valuation results.
- Intuitive Interface: Designed for ease of use, catering to both industry professionals and novices.
How It Works
- Step 1: Download the prebuilt Excel template featuring Guangzhou Haozhi Industrial Co., Ltd. (300503SZ) data.
- Step 2: Review the pre-filled sheets to gain insights into the key metrics.
- Step 3: Modify forecasts and assumptions in the editable yellow cells (WACC, growth, margins).
- Step 4: Instantly see the recalculated results, including the intrinsic value of Guangzhou Haozhi Industrial Co., Ltd. (300503SZ).
- Step 5: Use the results to make informed investment decisions or to create detailed reports.
Why Choose Guangzhou Haozhi Industrial Co., Ltd. ([300503SZ])?
- Time Efficiency: Skip the hassle of building complex models from the ground up – our tools are ready for immediate use.
- Enhanced Precision: Utilize dependable financial data and calculations that minimize valuation inaccuracies.
- Fully Adjustable: Customize the framework to align with your specific assumptions and forecasts.
- Intuitive Analysis: User-friendly charts and outputs facilitate straightforward interpretation of results.
- Preferred by Professionals: Crafted for experts who prioritize accuracy and ease of use.
Who Can Benefit from This Product?
- Investors: Assess the fair value of Guangzhou Haozhi Industrial Co.,Ltd. (300503SZ) effectively prior to making investment choices.
- CFOs: Utilize a high-quality DCF model for comprehensive financial reporting and analysis.
- Consultants: Seamlessly customize the template for client valuation reports.
- Entrepreneurs: Acquire knowledge of financial modeling techniques used by leading corporations.
- Educators: Employ it as an educational resource to illustrate valuation concepts.
Contents of the Template
- Operating and Balance Sheet Data: Pre-filled historical data and forecasts for Guangzhou Haozhi Industrial Co., Ltd. (300503SZ), including revenue, EBITDA, EBIT, and capital expenditures.
- WACC Calculation: A dedicated worksheet for calculating the Weighted Average Cost of Capital (WACC), featuring parameters such as Beta, risk-free rate, and share price.
- DCF Valuation (Unlevered and Levered): Customizable Discounted Cash Flow models that illustrate intrinsic value with comprehensive calculations.
- Financial Statements: Pre-loaded annual and quarterly financial statements to aid in analysis.
- Key Ratios: A selection of profitability, leverage, and efficiency ratios pertinent to Guangzhou Haozhi Industrial Co., Ltd. (300503SZ).
- Dashboard and Charts: A visual overview of valuation results and assumptions for straightforward analysis of outcomes.
Disclaimer
All information, articles, and product details provided on this website are for general informational and educational purposes only. We do not claim any ownership over, nor do we intend to infringe upon, any trademarks, copyrights, logos, brand names, or other intellectual property mentioned or depicted on this site. Such intellectual property remains the property of its respective owners, and any references here are made solely for identification or informational purposes, without implying any affiliation, endorsement, or partnership.
We make no representations or warranties, express or implied, regarding the accuracy, completeness, or suitability of any content or products presented. Nothing on this website should be construed as legal, tax, investment, financial, medical, or other professional advice. In addition, no part of this site—including articles or product references—constitutes a solicitation, recommendation, endorsement, advertisement, or offer to buy or sell any securities, franchises, or other financial instruments, particularly in jurisdictions where such activity would be unlawful.
All content is of a general nature and may not address the specific circumstances of any individual or entity. It is not a substitute for professional advice or services. Any actions you take based on the information provided here are strictly at your own risk. You accept full responsibility for any decisions or outcomes arising from your use of this website and agree to release us from any liability in connection with your use of, or reliance upon, the content or products found herein.