
|
Hubei Jiuzhiyang Infrared System Co., Ltd (300516.SZ) Valation DCF |
Entièrement Modifiable: Adapté À Vos Besoins Dans Excel Ou Sheets
Conception Professionnelle: Modèles Fiables Et Conformes Aux Normes Du Secteur
Pré-Construits Pour Une Utilisation Rapide Et Efficace
Compatible MAC/PC, entièrement débloqué
Aucune Expertise N'Est Requise; Facile À Suivre
Hubei Jiuzhiyang Infrared System Co., Ltd (300516.SZ) Bundle
Découvrez le véritable potentiel de Hubei Jiuzhiyang Infrared System Co., Ltd (300516SZ) avec notre calculatrice avancée DCF! Personnalisez les hypothèses essentielles, explorez divers scénarios et évaluez comment les ajustements influencent la valorisation de Hubei Jiuzhiyang Infrared System Co., Ltd (300516SZ) - le tout dans un modèle d'excel complet.
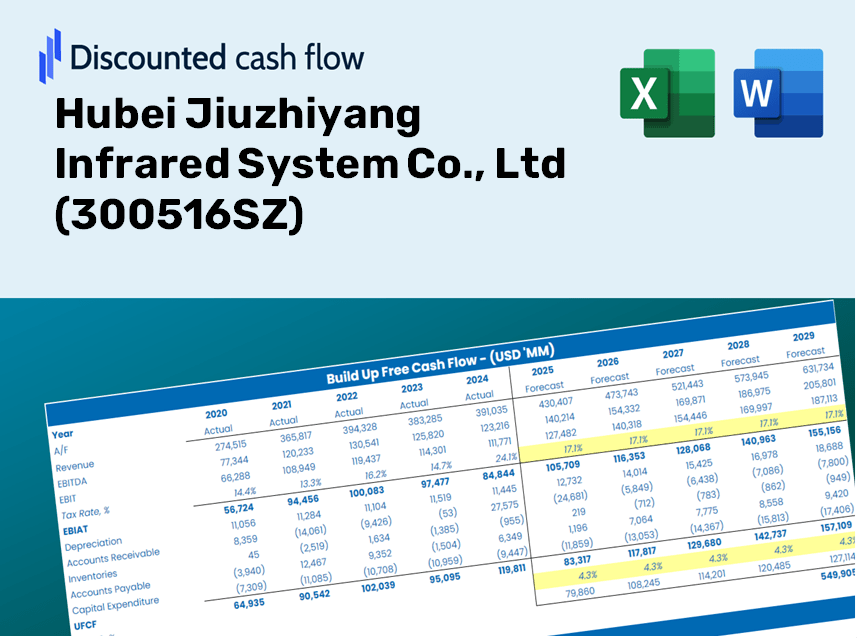
Discounted Cash Flow (DCF) - (USD MM)
| Year | AY1 2020 |
AY2 2021 |
AY3 2022 |
AY4 2023 |
AY5 2024 |
FY1 2025 |
FY2 2026 |
FY3 2027 |
FY4 2028 |
FY5 2029 |
|---|---|---|---|---|---|---|---|---|---|---|
| Revenue | 722.7 | 729.1 | 743.7 | 769.7 | 534.3 | 502.0 | 471.6 | 443.1 | 416.3 | 391.1 |
| Revenue Growth, % | 0 | 0.87823 | 2 | 3.5 | -30.58 | -6.05 | -6.05 | -6.05 | -6.05 | -6.05 |
| EBITDA | 101.6 | 111.3 | 140.4 | 111.7 | 55.3 | 73.4 | 68.9 | 64.8 | 60.8 | 57.2 |
| EBITDA, % | 14.06 | 15.27 | 18.88 | 14.52 | 10.35 | 14.62 | 14.62 | 14.62 | 14.62 | 14.62 |
| Depreciation | 30.8 | 34.0 | 30.7 | 31.3 | 30.1 | 22.8 | 21.5 | 20.2 | 18.9 | 17.8 |
| Depreciation, % | 4.26 | 4.66 | 4.13 | 4.06 | 5.64 | 4.55 | 4.55 | 4.55 | 4.55 | 4.55 |
| EBIT | 70.8 | 77.3 | 109.7 | 80.5 | 25.1 | 50.5 | 47.5 | 44.6 | 41.9 | 39.4 |
| EBIT, % | 9.8 | 10.6 | 14.76 | 10.45 | 4.71 | 10.06 | 10.06 | 10.06 | 10.06 | 10.06 |
| Total Cash | 580.7 | 478.4 | 406.8 | 310.3 | 365.7 | 310.7 | 291.9 | 274.2 | 257.6 | 242.0 |
| Total Cash, percent | .0 | .0 | .0 | .0 | .0 | .0 | .0 | .0 | .0 | .0 |
| Account Receivables | 288.7 | 420.3 | 554.7 | 864.6 | 798.1 | 373.7 | 351.1 | 329.8 | 309.9 | 291.1 |
| Account Receivables, % | 39.94 | 57.65 | 74.6 | 112.34 | 149.36 | 74.44 | 74.44 | 74.44 | 74.44 | 74.44 |
| Inventories | 298.4 | 307.5 | 247.4 | 276.3 | 244.6 | 199.2 | 187.2 | 175.8 | 165.2 | 155.2 |
| Inventories, % | 41.28 | 42.18 | 33.27 | 35.9 | 45.77 | 39.68 | 39.68 | 39.68 | 39.68 | 39.68 |
| Accounts Payable | 280.0 | 311.2 | 223.6 | 368.8 | 296.2 | 215.7 | 202.7 | 190.4 | 178.9 | 168.1 |
| Accounts Payable, % | 38.75 | 42.68 | 30.07 | 47.92 | 55.43 | 42.97 | 42.97 | 42.97 | 42.97 | 42.97 |
| Capital Expenditure | -19.0 | -41.9 | -17.2 | -19.6 | -19.9 | -17.0 | -16.0 | -15.0 | -14.1 | -13.3 |
| Capital Expenditure, % | -2.63 | -5.74 | -2.32 | -2.55 | -3.72 | -3.39 | -3.39 | -3.39 | -3.39 | -3.39 |
| Tax Rate, % | -23.37 | -23.37 | -23.37 | -23.37 | -23.37 | -23.37 | -23.37 | -23.37 | -23.37 | -23.37 |
| EBITAT | 68.2 | 78.1 | 109.3 | 83.0 | 31.0 | 50.1 | 47.1 | 44.2 | 41.5 | 39.0 |
| Depreciation | ||||||||||
| Changes in Account Receivables | ||||||||||
| Changes in Inventories | ||||||||||
| Changes in Accounts Payable | ||||||||||
| Capital Expenditure | ||||||||||
| UFCF | -227.0 | -39.4 | -39.2 | -98.9 | 66.9 | 445.3 | 74.1 | 69.7 | 65.4 | 61.5 |
| WACC, % | 5.52 | 5.52 | 5.52 | 5.52 | 5.52 | 5.52 | 5.52 | 5.52 | 5.52 | 5.52 |
| PV UFCF | ||||||||||
| SUM PV UFCF | 647.6 | |||||||||
| Long Term Growth Rate, % | 4.00 | |||||||||
| Free cash flow (T + 1) | 64 | |||||||||
| Terminal Value | 4,212 | |||||||||
| Present Terminal Value | 3,220 | |||||||||
| Enterprise Value | 3,868 | |||||||||
| Net Debt | -365 | |||||||||
| Equity Value | 4,233 | |||||||||
| Diluted Shares Outstanding, MM | 180 | |||||||||
| Equity Value Per Share | 23.52 |
What You Will Receive
- Authentic Hubei Jiuzhiyang Financial Data: Pre-loaded with historical and projected figures for accurate analysis.
- Completely Customizable Template: Easily adjust key inputs such as revenue growth, WACC, and EBITDA %.
- Instantaneous Calculations: Watch the intrinsic value of Hubei Jiuzhiyang update in real-time as you make changes.
- Professional Valuation Tool: Tailored for investors, analysts, and consultants looking for reliable DCF outcomes.
- Intuitive Design: A straightforward layout with clear instructions suitable for all skill levels.
Key Features
- Comprehensive DCF Analyzer: Offers in-depth unlevered and levered DCF valuation frameworks.
- WACC Estimator: Features a pre-configured Weighted Average Cost of Capital sheet with adjustable parameters.
- Customizable Forecast Inputs: Alter growth projections, capital spending, and discount rates as needed.
- Integrated Financial Metrics: Evaluate profitability, leverage, and efficiency ratios specific to Hubei Jiuzhiyang Infrared System Co., Ltd (300516SZ).
- Interactive Dashboard and Graphs: Visual representations provide a summary of essential valuation indicators for straightforward analysis.
How It Functions
- Step 1: Download the Excel spreadsheet.
- Step 2: Examine the pre-filled financial data and projections for Hubei Jiuzhiyang Infrared System Co., Ltd (300516SZ).
- Step 3: Adjust key variables such as revenue growth, WACC, and tax rates (highlighted cells).
- Step 4: Observe the DCF model refresh in real-time as you modify your assumptions.
- Step 5: Evaluate the results and utilize them for your investment strategies.
Why Choose This Calculator for Hubei Jiuzhiyang Infrared System Co., Ltd (300516SZ)?
- Reliable Data: Access genuine financial metrics of Hubei Jiuzhiyang for trustworthy valuation outcomes.
- Tailor-Made: Modify essential inputs such as growth rates, WACC, and tax rates to align with your forecasts.
- Efficient: Built-in calculations save time by removing the need to create models from scratch.
- Professional-Quality Tool: Specifically crafted for investors, analysts, and consultants in the field.
- Easy to Use: With a user-friendly design and clear, step-by-step guidance, it’s accessible for everyone.
Who Can Benefit from Hubei Jiuzhiyang Infrared System Co., Ltd (300516SZ)?
- Investors: Make informed choices with our advanced valuation tools tailored for precision.
- Financial Analysts: Streamline your workflow with our ready-to-customize DCF model.
- Consultants: Effortlessly modify our templates for impactful client presentations and reports.
- Finance Enthusiasts: Enhance your grasp of valuation methods through practical, real-life case studies.
- Educators and Students: Utilize our resources as an effective teaching aid in finance courses.
What the Template Includes
- Pre-Filled DCF Model: Hubei Jiuzhiyang Infrared System Co., Ltd (300516SZ) financial data preloaded for immediate access.
- WACC Calculator: Comprehensive calculations for Weighted Average Cost of Capital tailored for (300516SZ).
- Financial Ratios: Assess Hubei Jiuzhiyang’s profitability, leverage, and efficiency metrics.
- Editable Inputs: Modify assumptions such as growth rates, margins, and capital expenditures to align with your scenarios.
- Financial Statements: Annual and quarterly reports provided for in-depth analysis of (300516SZ).
- Interactive Dashboard: Effortlessly visualize essential valuation metrics and outcomes for (300516SZ).
Disclaimer
All information, articles, and product details provided on this website are for general informational and educational purposes only. We do not claim any ownership over, nor do we intend to infringe upon, any trademarks, copyrights, logos, brand names, or other intellectual property mentioned or depicted on this site. Such intellectual property remains the property of its respective owners, and any references here are made solely for identification or informational purposes, without implying any affiliation, endorsement, or partnership.
We make no representations or warranties, express or implied, regarding the accuracy, completeness, or suitability of any content or products presented. Nothing on this website should be construed as legal, tax, investment, financial, medical, or other professional advice. In addition, no part of this site—including articles or product references—constitutes a solicitation, recommendation, endorsement, advertisement, or offer to buy or sell any securities, franchises, or other financial instruments, particularly in jurisdictions where such activity would be unlawful.
All content is of a general nature and may not address the specific circumstances of any individual or entity. It is not a substitute for professional advice or services. Any actions you take based on the information provided here are strictly at your own risk. You accept full responsibility for any decisions or outcomes arising from your use of this website and agree to release us from any liability in connection with your use of, or reliance upon, the content or products found herein.