
|
Broadex Technologies Co., Ltd. (300548.SZ) Évaluation DCF |
Entièrement Modifiable: Adapté À Vos Besoins Dans Excel Ou Sheets
Conception Professionnelle: Modèles Fiables Et Conformes Aux Normes Du Secteur
Pré-Construits Pour Une Utilisation Rapide Et Efficace
Compatible MAC/PC, entièrement débloqué
Aucune Expertise N'Est Requise; Facile À Suivre
Broadex Technologies Co., Ltd. (300548.SZ) Bundle
Explorez les perspectives financières de Broadex Technologies Co., Ltd. (300548SZ) avec notre calculatrice DCF conviviale! Entrez vos hypothèses concernant la croissance, les marges et les dépenses pour déterminer la valeur intrinsèque de Broadex Technologies Co., Ltd. (300548SZ) et affinez votre approche d'investissement.
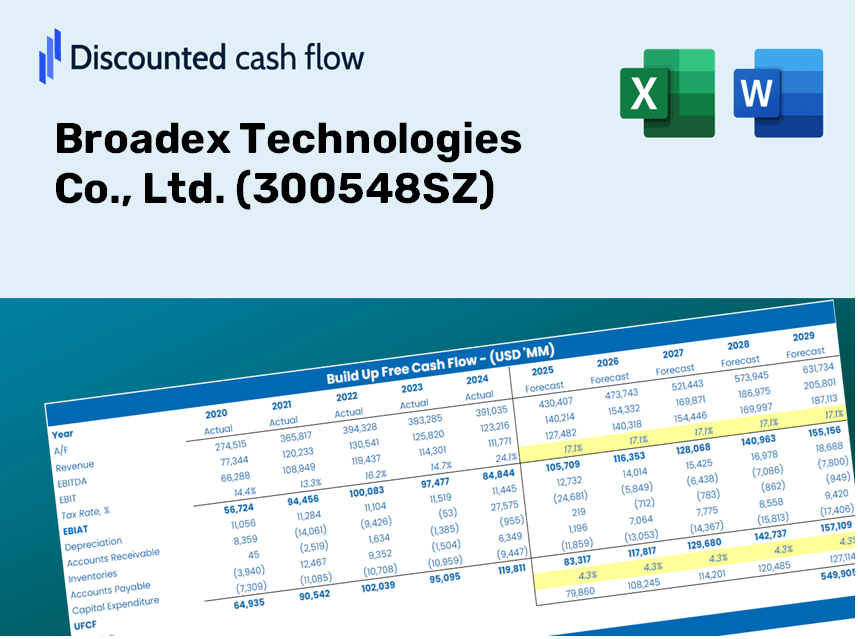
Discounted Cash Flow (DCF) - (USD MM)
| Year | AY1 2020 |
AY2 2021 |
AY3 2022 |
AY4 2023 |
AY5 2024 |
FY1 2025 |
FY2 2026 |
FY3 2027 |
FY4 2028 |
FY5 2029 |
|---|---|---|---|---|---|---|---|---|---|---|
| Revenue | 776.7 | 1,154.1 | 1,466.7 | 1,675.4 | 1,747.5 | 2,159.0 | 2,667.5 | 3,295.7 | 4,071.9 | 5,030.9 |
| Revenue Growth, % | 0 | 48.59 | 27.08 | 14.23 | 4.3 | 23.55 | 23.55 | 23.55 | 23.55 | 23.55 |
| EBITDA | 121.6 | 211.5 | 254.8 | 178.4 | 261.1 | 332.2 | 410.5 | 507.1 | 626.6 | 774.2 |
| EBITDA, % | 15.65 | 18.33 | 17.37 | 10.65 | 14.94 | 15.39 | 15.39 | 15.39 | 15.39 | 15.39 |
| Depreciation | 22.5 | 29.3 | 35.0 | 58.4 | 57.2 | 63.0 | 77.8 | 96.1 | 118.8 | 146.8 |
| Depreciation, % | 2.9 | 2.54 | 2.38 | 3.49 | 3.27 | 2.92 | 2.92 | 2.92 | 2.92 | 2.92 |
| EBIT | 99.0 | 182.2 | 219.8 | 119.9 | 203.9 | 269.2 | 332.7 | 411.0 | 507.8 | 627.4 |
| EBIT, % | 12.75 | 15.79 | 14.99 | 7.16 | 11.67 | 12.47 | 12.47 | 12.47 | 12.47 | 12.47 |
| Total Cash | 169.3 | 768.3 | 1,513.1 | 1,296.0 | 1,621.1 | 1,548.0 | 1,912.5 | 2,362.9 | 2,919.5 | 3,607.0 |
| Total Cash, percent | .0 | .0 | .0 | .0 | .0 | .0 | .0 | .0 | .0 | .0 |
| Account Receivables | 273.1 | 390.1 | 704.8 | 587.7 | 549.6 | 792.5 | 979.2 | 1,209.8 | 1,494.7 | 1,846.8 |
| Account Receivables, % | 35.16 | 33.8 | 48.05 | 35.08 | 31.45 | 36.71 | 36.71 | 36.71 | 36.71 | 36.71 |
| Inventories | 242.0 | 286.9 | 510.8 | 319.7 | 332.3 | 556.7 | 687.9 | 849.9 | 1,050.0 | 1,297.3 |
| Inventories, % | 31.15 | 24.86 | 34.82 | 19.08 | 19.02 | 25.79 | 25.79 | 25.79 | 25.79 | 25.79 |
| Accounts Payable | 169.8 | 221.1 | 556.4 | 378.6 | 173.9 | 481.5 | 594.9 | 735.0 | 908.1 | 1,122.0 |
| Accounts Payable, % | 21.86 | 19.16 | 37.94 | 22.6 | 9.95 | 22.3 | 22.3 | 22.3 | 22.3 | 22.3 |
| Capital Expenditure | -60.7 | -55.4 | -56.1 | -220.7 | -109.7 | -155.0 | -191.4 | -236.5 | -292.2 | -361.1 |
| Capital Expenditure, % | -7.81 | -4.8 | -3.82 | -13.17 | -6.28 | -7.18 | -7.18 | -7.18 | -7.18 | -7.18 |
| Tax Rate, % | 62.09 | 62.09 | 62.09 | 62.09 | 62.09 | 62.09 | 62.09 | 62.09 | 62.09 | 62.09 |
| EBITAT | 89.8 | 161.1 | 188.5 | 83.8 | 77.3 | 200.7 | 247.9 | 306.3 | 378.4 | 467.6 |
| Depreciation | ||||||||||
| Changes in Account Receivables | ||||||||||
| Changes in Inventories | ||||||||||
| Changes in Accounts Payable | ||||||||||
| Capital Expenditure | ||||||||||
| UFCF | -293.6 | 24.4 | -35.8 | 51.9 | -154.5 | -51.1 | -70.1 | -86.6 | -107.0 | -132.2 |
| WACC, % | 4.64 | 4.64 | 4.64 | 4.63 | 4.62 | 4.64 | 4.64 | 4.64 | 4.64 | 4.64 |
| PV UFCF | ||||||||||
| SUM PV UFCF | -383.0 | |||||||||
| Long Term Growth Rate, % | 3.50 | |||||||||
| Free cash flow (T + 1) | -137 | |||||||||
| Terminal Value | -12,047 | |||||||||
| Present Terminal Value | -9,605 | |||||||||
| Enterprise Value | -9,988 | |||||||||
| Net Debt | -524 | |||||||||
| Equity Value | -9,464 | |||||||||
| Diluted Shares Outstanding, MM | 288 | |||||||||
| Equity Value Per Share | -32.83 |
What You Will Receive
- Genuine Broadex Data: Preloaded financial information – encompassing revenue to EBIT – derived from both actual and projected metrics.
- Comprehensive Customization: Modify all essential variables (yellow cells) such as WACC, growth %, and tax rates.
- Immediate Valuation Adjustments: Automatic recalculations to assess the effects of changes on Broadex's fair value.
- Flexible Excel Template: Designed for quick edits, scenario analysis, and in-depth forecasting.
- Efficient and Precise: Avoid constructing models from the ground up while ensuring accuracy and adaptability.
Key Features
- Customizable Forecast Inputs: Adjust essential metrics such as revenue growth, EBITDA margin, and capital expenditures.
- Instant DCF Valuation: Automatically determines intrinsic value, NPV, and other financial metrics with ease.
- High-Precision Accuracy: Leverages Broadex Technologies' actual financial data for dependable valuation results.
- Streamlined Scenario Analysis: Effortlessly explore various assumptions and evaluate their impacts.
- Efficient Valuation Tool: Remove the necessity of constructing intricate valuation models from the ground up.
How It Works
- Step 1: Download the Excel file.
- Step 2: Review the pre-filled data for Broadex Technologies Co., Ltd. (300548SZ) (historical and forecasted).
- Step 3: Modify key assumptions (yellow cells) according to your analysis.
- Step 4: Observe the automatic recalculations for Broadex Technologies Co., Ltd. (300548SZ)'s intrinsic value.
- Step 5: Utilize the results for investment decisions or reporting purposes.
Why Choose the Broadex Technologies Calculator?
- Time Efficient: Skip the hassle of building a DCF model from the ground up – it's ready for immediate use.
- Enhance Precision: Dependable financial data and formulas minimize valuation errors.
- Completely Customizable: Adapt the model to suit your specific assumptions and forecasts.
- User-Friendly: Intuitive charts and outputs simplify result analysis.
- Endorsed by Professionals: Crafted for experts who prioritize accuracy and functionality.
Who Can Benefit from Broadex Technologies Co., Ltd. (300548SZ)?
- Engineering Students: Discover cutting-edge technologies and apply them to real-world scenarios.
- Researchers: Utilize advanced models in your studies or innovation projects.
- Investors: Validate your investment strategies and evaluate the performance of Broadex Technologies (300548SZ).
- Market Analysts: Enhance your analysis with our customizable financial models tailored for tech companies.
- Entrepreneurs: Learn how major tech firms like Broadex Technologies (300548SZ) are evaluated in the market.
What the Template Includes
- Pre-Filled DCF Model: Broadex Technologies Co., Ltd.'s (300548SZ) financial data ready for instant application.
- WACC Calculator: Comprehensive calculations for Weighted Average Cost of Capital.
- Financial Ratios: Assess Broadex's profitability, leverage, and operational efficiency.
- Editable Inputs: Modify assumptions like growth rates, profit margins, and CAPEX to suit your scenarios.
- Financial Statements: Access annual and quarterly reports for thorough analysis.
- Interactive Dashboard: Effortlessly visualize critical valuation metrics and outcomes.
Disclaimer
All information, articles, and product details provided on this website are for general informational and educational purposes only. We do not claim any ownership over, nor do we intend to infringe upon, any trademarks, copyrights, logos, brand names, or other intellectual property mentioned or depicted on this site. Such intellectual property remains the property of its respective owners, and any references here are made solely for identification or informational purposes, without implying any affiliation, endorsement, or partnership.
We make no representations or warranties, express or implied, regarding the accuracy, completeness, or suitability of any content or products presented. Nothing on this website should be construed as legal, tax, investment, financial, medical, or other professional advice. In addition, no part of this site—including articles or product references—constitutes a solicitation, recommendation, endorsement, advertisement, or offer to buy or sell any securities, franchises, or other financial instruments, particularly in jurisdictions where such activity would be unlawful.
All content is of a general nature and may not address the specific circumstances of any individual or entity. It is not a substitute for professional advice or services. Any actions you take based on the information provided here are strictly at your own risk. You accept full responsibility for any decisions or outcomes arising from your use of this website and agree to release us from any liability in connection with your use of, or reliance upon, the content or products found herein.