
|
Shenzhen Senior Technology Material Co., Ltd (300568.SZ) Évaluation DCF |
Entièrement Modifiable: Adapté À Vos Besoins Dans Excel Ou Sheets
Conception Professionnelle: Modèles Fiables Et Conformes Aux Normes Du Secteur
Pré-Construits Pour Une Utilisation Rapide Et Efficace
Compatible MAC/PC, entièrement débloqué
Aucune Expertise N'Est Requise; Facile À Suivre
Shenzhen Senior Technology Material Co., LTD (300568.SZ) Bundle
Découvrez le véritable potentiel de Shenzhen Senior Technology Material Co., Ltd (300568SZ) avec notre calculatrice avancée DCF! Ajustez les hypothèses essentielles, explorez divers scénarios et évaluez comment les différents changements influencent l'évaluation de Shenzhen Senior Technology Material Co., Ltd (300568SZ) - le tout dans un modèle Excel pratique.
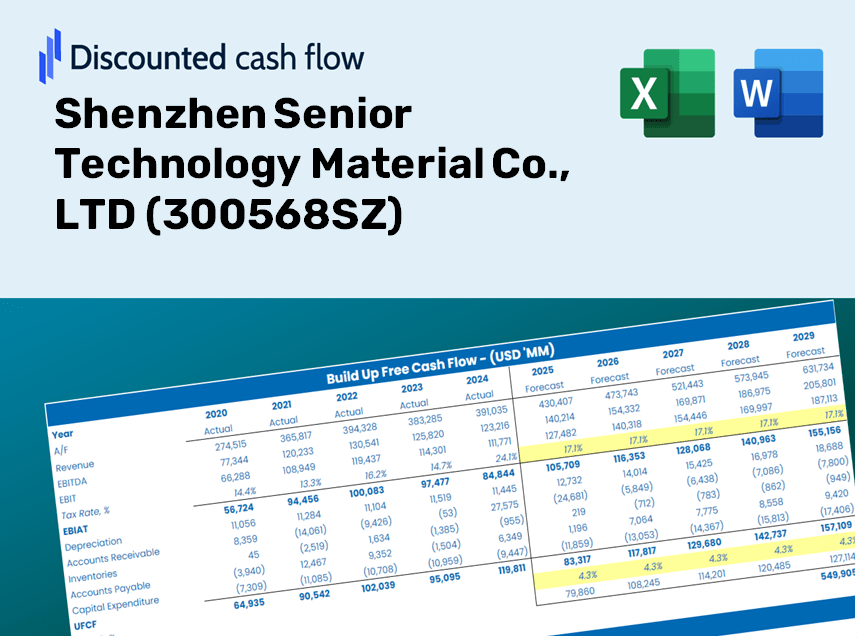
Discounted Cash Flow (DCF) - (USD MM)
| Year | AY1 2020 |
AY2 2021 |
AY3 2022 |
AY4 2023 |
AY5 2024 |
FY1 2025 |
FY2 2026 |
FY3 2027 |
FY4 2028 |
FY5 2029 |
|---|---|---|---|---|---|---|---|---|---|---|
| Revenue | 966.6 | 1,860.5 | 2,880.3 | 3,013.2 | 3,541.1 | 5,040.9 | 7,176.0 | 10,215.4 | 14,542.2 | 20,701.5 |
| Revenue Growth, % | 0 | 92.48 | 54.81 | 4.62 | 17.52 | 42.35 | 42.35 | 42.35 | 42.35 | 42.35 |
| EBITDA | 379.1 | 706.9 | 1,291.5 | 1,270.2 | 1,154.0 | 1,984.0 | 2,824.3 | 4,020.6 | 5,723.5 | 8,147.7 |
| EBITDA, % | 39.22 | 37.99 | 44.84 | 42.15 | 32.59 | 39.36 | 39.36 | 39.36 | 39.36 | 39.36 |
| Depreciation | 202.5 | 349.2 | 371.7 | 451.4 | 609.3 | 855.1 | 1,217.3 | 1,732.9 | 2,466.8 | 3,511.6 |
| Depreciation, % | 20.95 | 18.77 | 12.9 | 14.98 | 17.21 | 16.96 | 16.96 | 16.96 | 16.96 | 16.96 |
| EBIT | 176.6 | 357.6 | 919.8 | 818.7 | 544.6 | 1,128.9 | 1,607.1 | 2,287.7 | 3,256.7 | 4,636.0 |
| EBIT, % | 18.27 | 19.22 | 31.93 | 27.17 | 15.38 | 22.39 | 22.39 | 22.39 | 22.39 | 22.39 |
| Total Cash | 438.4 | 1,234.3 | 4,686.4 | 4,744.0 | 3,977.3 | 4,150.6 | 5,908.7 | 8,411.3 | 11,973.8 | 17,045.3 |
| Total Cash, percent | .0 | .0 | .0 | .0 | .0 | .0 | .0 | .0 | .0 | .0 |
| Account Receivables | 845.9 | 1,190.8 | 1,587.4 | 1,852.8 | 2,980.5 | 3,551.6 | 5,055.9 | 7,197.3 | 10,245.7 | 14,585.3 |
| Account Receivables, % | 87.51 | 64 | 55.11 | 61.49 | 84.17 | 70.46 | 70.46 | 70.46 | 70.46 | 70.46 |
| Inventories | 189.6 | 268.8 | 283.7 | 396.9 | 518.1 | 723.1 | 1,029.3 | 1,465.3 | 2,085.9 | 2,969.3 |
| Inventories, % | 19.62 | 14.45 | 9.85 | 13.17 | 14.63 | 14.34 | 14.34 | 14.34 | 14.34 | 14.34 |
| Accounts Payable | 655.7 | 530.2 | 1,035.4 | 658.7 | 1,522.6 | 1,987.5 | 2,829.3 | 4,027.6 | 5,733.5 | 8,161.9 |
| Accounts Payable, % | 67.83 | 28.5 | 35.95 | 21.86 | 43 | 39.43 | 39.43 | 39.43 | 39.43 | 39.43 |
| Capital Expenditure | -448.8 | -1,151.2 | -2,348.5 | -4,209.8 | -4,552.6 | -3,930.3 | -5,595.0 | -7,964.8 | -11,338.3 | -16,140.6 |
| Capital Expenditure, % | -46.43 | -61.87 | -81.54 | -139.71 | -128.57 | -77.97 | -77.97 | -77.97 | -77.97 | -77.97 |
| Tax Rate, % | 10.91 | 10.91 | 10.91 | 10.91 | 10.91 | 10.91 | 10.91 | 10.91 | 10.91 | 10.91 |
| EBITAT | 153.4 | 348.1 | 780.2 | 658.1 | 485.2 | 990.1 | 1,409.4 | 2,006.4 | 2,856.1 | 4,065.9 |
| Depreciation | ||||||||||
| Changes in Account Receivables | ||||||||||
| Changes in Inventories | ||||||||||
| Changes in Accounts Payable | ||||||||||
| Capital Expenditure | ||||||||||
| UFCF | -472.7 | -1,003.4 | -1,102.9 | -3,855.5 | -3,843.0 | -2,396.4 | -3,937.1 | -5,604.6 | -7,978.4 | -11,357.7 |
| WACC, % | 7.27 | 7.41 | 7.25 | 7.19 | 7.3 | 7.29 | 7.29 | 7.29 | 7.29 | 7.29 |
| PV UFCF | ||||||||||
| SUM PV UFCF | -24,205.8 | |||||||||
| Long Term Growth Rate, % | 2.00 | |||||||||
| Free cash flow (T + 1) | -11,585 | |||||||||
| Terminal Value | -219,194 | |||||||||
| Present Terminal Value | -154,216 | |||||||||
| Enterprise Value | -178,422 | |||||||||
| Net Debt | 6,837 | |||||||||
| Equity Value | -185,258 | |||||||||
| Diluted Shares Outstanding, MM | 1,342 | |||||||||
| Equity Value Per Share | -138.04 |
What You Will Receive
- Authentic 300568 Financial Data: Pre-populated with Shenzhen Senior Technology Material Co., LTD’s historical and projected metrics for accurate assessments.
- Customizable Template: Easily adjust essential inputs such as revenue growth, WACC, and EBITDA percentage.
- Instant Calculations: Watch the intrinsic value of 300568 update in real-time as you make changes.
- Expert Valuation Tool: Crafted for investors, analysts, and consultants who require reliable DCF outputs.
- Intuitive Design: Clear layout and straightforward instructions suitable for all skill levels.
Key Features
- Advanced DCF Calculator: Features comprehensive unlevered and levered DCF valuation models tailored for Shenzhen Senior Technology Material Co., LTD (300568SZ).
- WACC Calculator: Ready-to-use Weighted Average Cost of Capital sheet with adjustable input parameters.
- Customizable Forecast Assumptions: Update growth rates, capital expenditures, and discount rates as needed.
- Integrated Financial Ratios: Evaluate profitability, leverage, and efficiency metrics specifically for Shenzhen Senior Technology Material Co., LTD (300568SZ).
- Dashboard and Visualizations: Graphical representations summarize essential valuation metrics for straightforward analysis.
How It Operates
- Download the Template: Gain immediate access to the Excel-based Shenzhen Senior Technology Material Co., LTD DCF Calculator.
- Input Your Assumptions: Modify the yellow-highlighted cells for growth rates, WACC, margins, and other key variables.
- Instant Calculations: The model automatically recalculates the intrinsic value of Shenzhen Senior Technology Material Co., LTD (300568SZ).
- Test Scenarios: Experiment with various assumptions to assess potential changes in valuation.
- Analyze and Decide: Utilize the outcomes to inform your investment or financial strategy.
Why Select This Calculator for Shenzhen Senior Technology Material Co., LTD (300568SZ)?
- Reliable Data: Access to authentic financials of Shenzhen Senior Technology Material ensures trustworthy valuation outcomes.
- Flexible Customization: Tailor essential parameters such as growth rates, WACC, and tax rates to align with your forecasts.
- Efficiency Boost: Ready-made calculations save you from having to build models from the ground up.
- Expert-Quality Tool: Crafted for investors, analysts, and consultants seeking in-depth analysis.
- User-Centric Design: An intuitive interface with step-by-step guidance accommodates users of all experience levels.
Who Should Consider This Product?
- Investors: Accurately assess the fair value of Shenzhen Senior Technology Material Co., Ltd (300568SZ) before making investment choices.
- CFOs: Utilize a professional-grade DCF model for detailed financial analysis and reporting.
- Consultants: Swiftly customize the template for client valuation reports.
- Entrepreneurs: Acquire insights into financial modeling practices adopted by leading firms.
- Educators: Employ it as a resource to illustrate valuation techniques in the classroom.
Contents of the Template
- Operating and Balance Sheet Data: Pre-filled historical data and forecasts for Shenzhen Senior Technology Material Co., LTD (300568SZ), including revenue, EBITDA, EBIT, and capital expenditures.
- WACC Calculation: A dedicated sheet for the Weighted Average Cost of Capital (WACC), featuring parameters such as Beta, risk-free rate, and share price.
- DCF Valuation (Unlevered and Levered): Editable Discounted Cash Flow models that illustrate intrinsic value with comprehensive calculations.
- Financial Statements: Pre-loaded annual and quarterly financial statements to facilitate analysis.
- Key Ratios: Includes profitability, leverage, and efficiency ratios pertinent to Shenzhen Senior Technology Material Co., LTD (300568SZ).
- Dashboard and Charts: A visual summary of valuation outputs and assumptions, designed for easy result analysis.
Disclaimer
All information, articles, and product details provided on this website are for general informational and educational purposes only. We do not claim any ownership over, nor do we intend to infringe upon, any trademarks, copyrights, logos, brand names, or other intellectual property mentioned or depicted on this site. Such intellectual property remains the property of its respective owners, and any references here are made solely for identification or informational purposes, without implying any affiliation, endorsement, or partnership.
We make no representations or warranties, express or implied, regarding the accuracy, completeness, or suitability of any content or products presented. Nothing on this website should be construed as legal, tax, investment, financial, medical, or other professional advice. In addition, no part of this site—including articles or product references—constitutes a solicitation, recommendation, endorsement, advertisement, or offer to buy or sell any securities, franchises, or other financial instruments, particularly in jurisdictions where such activity would be unlawful.
All content is of a general nature and may not address the specific circumstances of any individual or entity. It is not a substitute for professional advice or services. Any actions you take based on the information provided here are strictly at your own risk. You accept full responsibility for any decisions or outcomes arising from your use of this website and agree to release us from any liability in connection with your use of, or reliance upon, the content or products found herein.