
|
Queclink Wireless Solutions Co., Ltd. (300590.SZ) Évaluation DCF |
Entièrement Modifiable: Adapté À Vos Besoins Dans Excel Ou Sheets
Conception Professionnelle: Modèles Fiables Et Conformes Aux Normes Du Secteur
Pré-Construits Pour Une Utilisation Rapide Et Efficace
Compatible MAC/PC, entièrement débloqué
Aucune Expertise N'Est Requise; Facile À Suivre
Queclink Wireless Solutions Co., Ltd. (300590.SZ) Bundle
Améliorez vos stratégies d'investissement avec la calculatrice DCF (300590SZ)! Obtenez des données financières en temps réel pour Queclink Wireless Solutions Co., Ltd., ajustez les projections et dépenses de croissance et observez immédiatement comment ces changements influencent la valeur intrinsèque de l'entreprise.
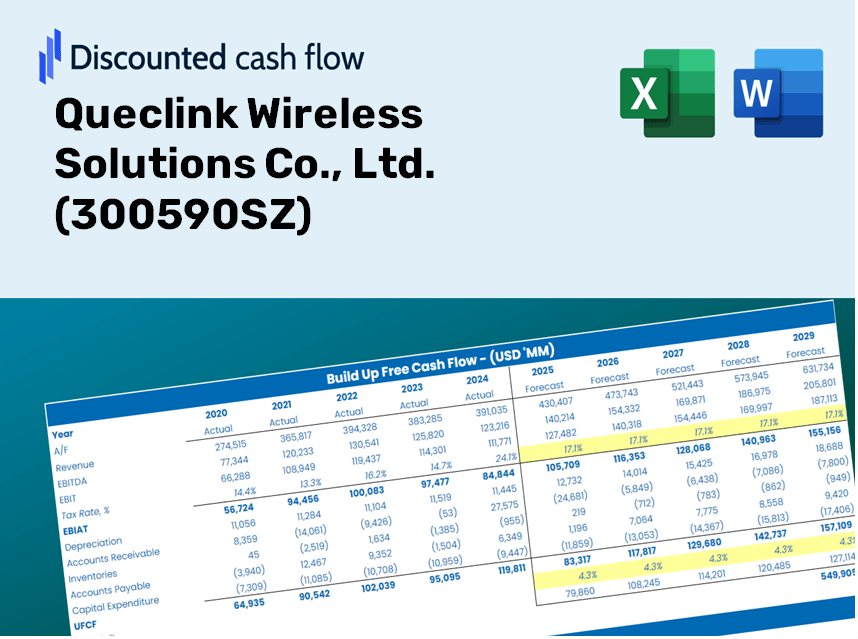
Discounted Cash Flow (DCF) - (USD MM)
| Year | AY1 2020 |
AY2 2021 |
AY3 2022 |
AY4 2023 |
AY5 2024 |
FY1 2025 |
FY2 2026 |
FY3 2027 |
FY4 2028 |
FY5 2029 |
|---|---|---|---|---|---|---|---|---|---|---|
| Revenue | 472.7 | 920.7 | 1,002.2 | 1,015.8 | 966.9 | 1,209.0 | 1,511.8 | 1,890.5 | 2,364.0 | 2,956.0 |
| Revenue Growth, % | 0 | 94.79 | 8.85 | 1.35 | -4.81 | 25.05 | 25.05 | 25.05 | 25.05 | 25.05 |
| EBITDA | 109.6 | 186.1 | 197.8 | 183.6 | 186.5 | 243.0 | 303.9 | 380.0 | 475.1 | 594.2 |
| EBITDA, % | 23.18 | 20.22 | 19.74 | 18.08 | 19.29 | 20.1 | 20.1 | 20.1 | 20.1 | 20.1 |
| Depreciation | 9.1 | 20.7 | 28.0 | 27.9 | 17.7 | 27.9 | 34.9 | 43.6 | 54.5 | 68.2 |
| Depreciation, % | 1.92 | 2.24 | 2.8 | 2.75 | 1.83 | 2.31 | 2.31 | 2.31 | 2.31 | 2.31 |
| EBIT | 100.5 | 165.5 | 169.8 | 155.7 | 168.8 | 215.1 | 269.0 | 336.4 | 420.6 | 525.9 |
| EBIT, % | 21.27 | 17.97 | 16.94 | 15.33 | 17.46 | 17.79 | 17.79 | 17.79 | 17.79 | 17.79 |
| Total Cash | 544.6 | 768.6 | 618.5 | 842.6 | 1,075.2 | 1,035.3 | 1,294.6 | 1,618.8 | 2,024.2 | 2,531.2 |
| Total Cash, percent | .0 | .0 | .0 | .0 | .0 | .0 | .0 | .0 | .0 | .0 |
| Account Receivables | 96.1 | 123.8 | 265.4 | 273.0 | 273.7 | 279.1 | 349.0 | 436.4 | 545.7 | 682.4 |
| Account Receivables, % | 20.32 | 13.44 | 26.48 | 26.88 | 28.3 | 23.09 | 23.09 | 23.09 | 23.09 | 23.09 |
| Inventories | 209.2 | 584.6 | 612.6 | 494.4 | 350.8 | 613.7 | 767.4 | 959.7 | 1,200.0 | 1,500.5 |
| Inventories, % | 44.25 | 63.49 | 61.12 | 48.67 | 36.28 | 50.76 | 50.76 | 50.76 | 50.76 | 50.76 |
| Accounts Payable | 113.9 | 208.8 | 37.3 | 111.4 | 168.1 | 190.7 | 238.4 | 298.1 | 372.8 | 466.2 |
| Accounts Payable, % | 24.1 | 22.67 | 3.72 | 10.97 | 17.38 | 15.77 | 15.77 | 15.77 | 15.77 | 15.77 |
| Capital Expenditure | -56.7 | -40.6 | -20.2 | -11.7 | -10.8 | -50.0 | -62.6 | -78.2 | -97.8 | -122.3 |
| Capital Expenditure, % | -12 | -4.41 | -2.01 | -1.15 | -1.12 | -4.14 | -4.14 | -4.14 | -4.14 | -4.14 |
| Tax Rate, % | 5.92 | 5.92 | 5.92 | 5.92 | 5.92 | 5.92 | 5.92 | 5.92 | 5.92 | 5.92 |
| EBITAT | 91.0 | 153.8 | 158.6 | 147.9 | 158.8 | 200.5 | 250.7 | 313.5 | 392.0 | 490.2 |
| Depreciation | ||||||||||
| Changes in Account Receivables | ||||||||||
| Changes in Inventories | ||||||||||
| Changes in Accounts Payable | ||||||||||
| Capital Expenditure | ||||||||||
| UFCF | -148.0 | -174.4 | -174.6 | 348.9 | 365.2 | -67.5 | 47.2 | 59.0 | 73.8 | 92.2 |
| WACC, % | 11.17 | 11.17 | 11.17 | 11.17 | 11.17 | 11.17 | 11.17 | 11.17 | 11.17 | 11.17 |
| PV UFCF | ||||||||||
| SUM PV UFCF | 123.1 | |||||||||
| Long Term Growth Rate, % | 3.50 | |||||||||
| Free cash flow (T + 1) | 95 | |||||||||
| Terminal Value | 1,245 | |||||||||
| Present Terminal Value | 733 | |||||||||
| Enterprise Value | 856 | |||||||||
| Net Debt | -537 | |||||||||
| Equity Value | 1,393 | |||||||||
| Diluted Shares Outstanding, MM | 453 | |||||||||
| Equity Value Per Share | 3.07 |
Benefits You Will Receive
- Comprehensive Financial Model: Leverage Queclink’s actual data for accurate DCF valuation.
- Complete Forecast Customization: Modify revenue growth, profit margins, WACC, and other critical parameters.
- Real-Time Calculations: Automatic updates allow you to see outcomes immediately as adjustments are made.
- Professional-Grade Template: A polished Excel file tailored for high-standard valuation processes.
- Flexible and Reusable: Designed for adaptability, enabling multiple applications for in-depth forecasts.
Key Features
- Authentic Financial Data: Gain access to reliable pre-loaded historical figures and future outlooks for Queclink Wireless Solutions Co., Ltd. (300590SZ).
- Tailorable Forecast Parameters: Modify highlighted fields such as WACC, growth rates, and profit margins to suit your analysis.
- Real-Time Calculations: Automatic recalculations for DCF, Net Present Value (NPV), and cash flow metrics.
- Interactive Dashboard: User-friendly charts and summaries to effectively visualize your valuation outcomes.
- Designed for All Experience Levels: An intuitive and straightforward layout catering to investors, CFOs, and consultants alike.
How It Works
- Step 1: Download the Excel file.
- Step 2: Review Queclink Wireless Solutions Co., Ltd.’s pre-filled financial data and forecasts.
- Step 3: Adjust key inputs such as revenue growth, WACC, and tax rates (highlighted cells).
- Step 4: Observe the DCF model refresh in real-time as you modify your assumptions.
- Step 5: Evaluate the outputs and leverage the results for your investment strategies.
Why Select Queclink Wireless Solutions (300590SZ)?
- Precision: Reliable financial data guarantees high accuracy.
- Adaptability: Built for users to easily experiment with and adjust inputs.
- Efficiency: Eliminate the complexities of creating a DCF model from the ground up.
- Expert-Level Quality: Crafted with the expertise and usability expected at the CFO level.
- Intuitive Interface: Simple to navigate, even for those without extensive financial modeling knowledge.
Who Should Utilize This Product?
- Investors: Evaluate Queclink Wireless Solutions' valuation before making buying or selling decisions on stocks.
- CFOs and Financial Analysts: Optimize valuation workflows and assess financial projections with ease.
- Startup Founders: Understand the valuation methods applied to leading public companies like Queclink Wireless Solutions.
- Consultants: Provide comprehensive valuation reports to clients in need of expert insights.
- Students and Educators: Apply real-time data to enhance the understanding and teaching of valuation methodologies.
Contents of the Template
- Pre-Filled Data: Contains historical financials and projections for Queclink Wireless Solutions Co., Ltd. (300590SZ).
- Discounted Cash Flow Model: An editable DCF valuation model featuring automatic calculations.
- Weighted Average Cost of Capital (WACC): A dedicated section for WACC calculations based on your custom inputs.
- Key Financial Ratios: Evaluate Queclink's profitability, efficiency, and financial leverage.
- Customizable Inputs: Easily modify revenue growth, margins, and tax rates as needed.
- Clear Dashboard: Visual representations and tables highlighting essential valuation results.
Disclaimer
All information, articles, and product details provided on this website are for general informational and educational purposes only. We do not claim any ownership over, nor do we intend to infringe upon, any trademarks, copyrights, logos, brand names, or other intellectual property mentioned or depicted on this site. Such intellectual property remains the property of its respective owners, and any references here are made solely for identification or informational purposes, without implying any affiliation, endorsement, or partnership.
We make no representations or warranties, express or implied, regarding the accuracy, completeness, or suitability of any content or products presented. Nothing on this website should be construed as legal, tax, investment, financial, medical, or other professional advice. In addition, no part of this site—including articles or product references—constitutes a solicitation, recommendation, endorsement, advertisement, or offer to buy or sell any securities, franchises, or other financial instruments, particularly in jurisdictions where such activity would be unlawful.
All content is of a general nature and may not address the specific circumstances of any individual or entity. It is not a substitute for professional advice or services. Any actions you take based on the information provided here are strictly at your own risk. You accept full responsibility for any decisions or outcomes arising from your use of this website and agree to release us from any liability in connection with your use of, or reliance upon, the content or products found herein.