
|
Zhongfu Information Inc. (300659.SZ) Évaluation DCF |
Entièrement Modifiable: Adapté À Vos Besoins Dans Excel Ou Sheets
Conception Professionnelle: Modèles Fiables Et Conformes Aux Normes Du Secteur
Pré-Construits Pour Une Utilisation Rapide Et Efficace
Compatible MAC/PC, entièrement débloqué
Aucune Expertise N'Est Requise; Facile À Suivre
Zhongfu Information Inc. (300659.SZ) Bundle
Améliorez vos stratégies d'investissement avec la calculatrice [symbole] DCF! Plongez dans l'authentique Zhongfu Information Inc. Financials, ajustez les projections et dépenses de croissance et observez instantanément comment ces modifications affectent la valeur intrinsèque [symbole].
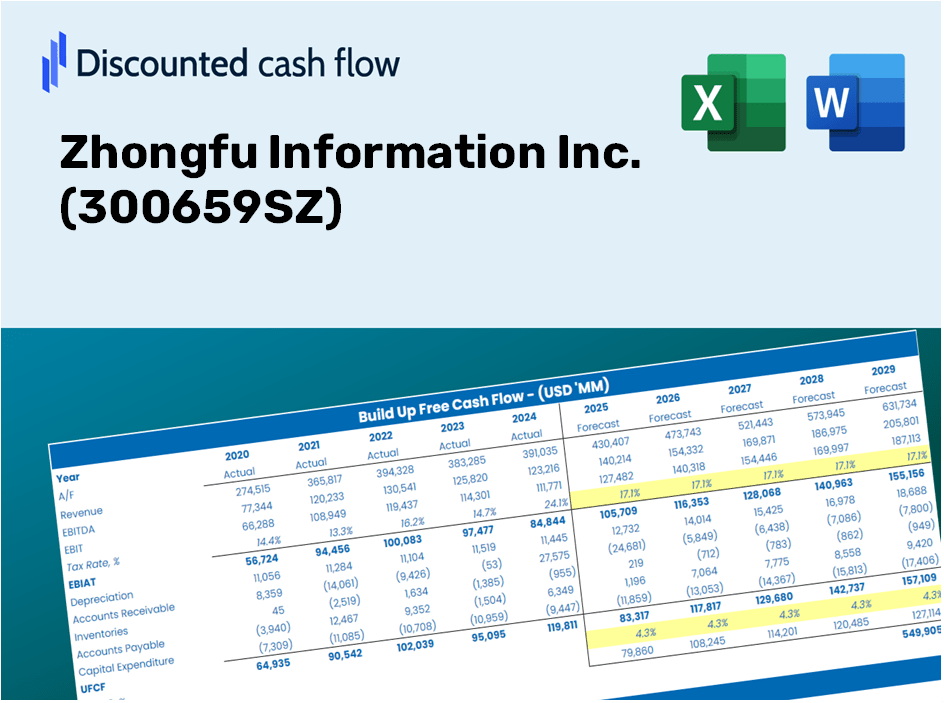
Discounted Cash Flow (DCF) - (USD MM)
| Year | AY1 2020 |
AY2 2021 |
AY3 2022 |
AY4 2023 |
AY5 2024 |
FY1 2025 |
FY2 2026 |
FY3 2027 |
FY4 2028 |
FY5 2029 |
|---|---|---|---|---|---|---|---|---|---|---|
| Revenue | 992.7 | 1,270.0 | 644.2 | 918.6 | 785.2 | 798.5 | 811.9 | 825.6 | 839.5 | 853.6 |
| Revenue Growth, % | 0 | 27.93 | -49.28 | 42.59 | -14.52 | 1.68 | 1.68 | 1.68 | 1.68 | 1.68 |
| EBITDA | 272.4 | 173.1 | -349.4 | -101.0 | -43.3 | -47.4 | -48.2 | -49.0 | -49.8 | -50.7 |
| EBITDA, % | 27.44 | 13.63 | -54.24 | -10.99 | -5.51 | -5.93 | -5.93 | -5.93 | -5.93 | -5.93 |
| Depreciation | 16.8 | 57.2 | 88.7 | 90.5 | 76.8 | 63.2 | 64.3 | 65.4 | 66.5 | 67.6 |
| Depreciation, % | 1.7 | 4.5 | 13.77 | 9.85 | 9.77 | 7.92 | 7.92 | 7.92 | 7.92 | 7.92 |
| EBIT | 255.6 | 115.9 | -438.1 | -191.5 | -120.1 | -110.6 | -112.5 | -114.4 | -116.3 | -118.3 |
| EBIT, % | 25.75 | 9.13 | -68.01 | -20.85 | -15.29 | -13.85 | -13.85 | -13.85 | -13.85 | -13.85 |
| Total Cash | 1,205.5 | 682.9 | 543.8 | 367.9 | 603.1 | 567.0 | 576.5 | 586.2 | 596.1 | 606.1 |
| Total Cash, percent | .0 | .0 | .0 | .0 | .0 | .0 | .0 | .0 | .0 | .0 |
| Account Receivables | 469.6 | 598.9 | 452.1 | 475.2 | 467.8 | 440.7 | 448.1 | 455.7 | 463.3 | 471.1 |
| Account Receivables, % | 47.31 | 47.16 | 70.18 | 51.74 | 59.58 | 55.19 | 55.19 | 55.19 | 55.19 | 55.19 |
| Inventories | 90.8 | 96.2 | 140.7 | 93.5 | 65.5 | 91.2 | 92.7 | 94.3 | 95.9 | 97.5 |
| Inventories, % | 9.15 | 7.58 | 21.85 | 10.18 | 8.35 | 11.42 | 11.42 | 11.42 | 11.42 | 11.42 |
| Accounts Payable | 179.7 | 217.3 | 150.6 | 189.7 | 152.0 | 157.5 | 160.1 | 162.8 | 165.5 | 168.3 |
| Accounts Payable, % | 18.1 | 17.11 | 23.37 | 20.65 | 19.36 | 19.72 | 19.72 | 19.72 | 19.72 | 19.72 |
| Capital Expenditure | -78.2 | -464.4 | -87.8 | -127.0 | -163.9 | -148.1 | -150.6 | -153.2 | -155.8 | -158.4 |
| Capital Expenditure, % | -7.88 | -36.56 | -13.62 | -13.83 | -20.87 | -18.55 | -18.55 | -18.55 | -18.55 | -18.55 |
| Tax Rate, % | 2.28 | 2.28 | 2.28 | 2.28 | 2.28 | 2.28 | 2.28 | 2.28 | 2.28 | 2.28 |
| EBITAT | 241.9 | 110.8 | -441.6 | -190.9 | -117.3 | -107.9 | -109.7 | -111.5 | -113.4 | -115.3 |
| Depreciation | ||||||||||
| Changes in Account Receivables | ||||||||||
| Changes in Inventories | ||||||||||
| Changes in Accounts Payable | ||||||||||
| Capital Expenditure | ||||||||||
| UFCF | -200.3 | -393.4 | -405.1 | -164.2 | -206.7 | -185.9 | -202.3 | -205.7 | -209.2 | -212.7 |
| WACC, % | 10.7 | 10.7 | 10.71 | 10.71 | 10.7 | 10.7 | 10.7 | 10.7 | 10.7 | 10.7 |
| PV UFCF | ||||||||||
| SUM PV UFCF | -751.9 | |||||||||
| Long Term Growth Rate, % | 2.00 | |||||||||
| Free cash flow (T + 1) | -217 | |||||||||
| Terminal Value | -2,493 | |||||||||
| Present Terminal Value | -1,500 | |||||||||
| Enterprise Value | -2,252 | |||||||||
| Net Debt | -323 | |||||||||
| Equity Value | -1,929 | |||||||||
| Diluted Shares Outstanding, MM | 250 | |||||||||
| Equity Value Per Share | -7.71 |
What You Will Receive
- Authentic Zhongfu Data: Preloaded financial information – encompassing revenue through EBIT – derived from real and projected figures.
- Comprehensive Customization: Modify all essential parameters (yellow cells) such as WACC, growth rates, and tax percentages.
- Immediate Valuation Refreshes: Automatic recalculations to evaluate the effects of adjustments on Zhongfu's fair value.
- Flexible Excel Template: Designed for swift modifications, scenario analyses, and in-depth forecasting.
- Efficient and Precise: Avoid the hassle of building models from the ground up while ensuring accuracy and adaptability.
Key Features
- Pre-Loaded Data: Historical financial statements and forecasts for Zhongfu Information Inc. (300659SZ).
- Fully Adjustable Inputs: Customize WACC, tax rates, revenue growth projections, and EBITDA margins.
- Instant Results: View the intrinsic value of Zhongfu Information Inc. (300659SZ) recalculated in real time.
- Clear Visual Outputs: Dashboard charts illustrate valuation results and essential metrics.
- Built for Accuracy: A professional-grade tool designed for analysts, investors, and finance professionals.
How It Works
- Download: Obtain the ready-to-use Excel file containing financial data for Zhongfu Information Inc. (300659SZ).
- Customize: Modify forecasts, including revenue growth, EBITDA %, and WACC to suit your analysis.
- Update Automatically: Watch as the intrinsic value and NPV calculations refresh in real-time.
- Test Scenarios: Generate multiple projections and instantly compare the results.
- Make Decisions: Utilize the valuation findings to inform your investment strategy.
Why Opt for This Calculator?
- All-in-One Solution: Incorporates DCF, WACC, and comprehensive financial ratio analysis into a single tool.
- Flexible Inputs: Modify the yellow-highlighted fields to explore different financial scenarios.
- In-Depth Analysis: Automatically determines Zhongfu Information Inc.'s intrinsic value and Net Present Value.
- Preloaded Data: Historical and projected data provide accurate baseline figures.
- Expert-Level Quality: Perfect for financial analysts, investors, and business advisors.
Who Can Benefit from Zhongfu Information Inc. (300659SZ)?
- Students in Finance: Master valuation methodologies and implement them with actual market data.
- Researchers: Utilize industry-standard models for academic projects and studies.
- Investors: Validate your investment hypotheses and examine valuation metrics for Zhongfu Information Inc. (300659SZ).
- Financial Analysts: Enhance your efficiency with a ready-to-use, customizable discounted cash flow (DCF) model.
- Entrepreneurs: Understand how major publicly traded companies like Zhongfu Information Inc. (300659SZ) are evaluated.
Contents of the Template
- Preloaded ZHONGFU Data: Historical and projected financial metrics, including revenue, EBIT, and capital expenditures.
- DCF and WACC Models: High-quality sheets designed for calculating intrinsic value and Weighted Average Cost of Capital.
- Editable Inputs: Yellow-highlighted cells for modifying revenue growth, tax rates, and discount rates.
- Financial Statements: Detailed annual and quarterly financials for comprehensive analysis.
- Key Ratios: Metrics on profitability, leverage, and efficiency for performance assessment.
- Dashboard and Charts: Visual representations of valuation results and key assumptions.
Disclaimer
All information, articles, and product details provided on this website are for general informational and educational purposes only. We do not claim any ownership over, nor do we intend to infringe upon, any trademarks, copyrights, logos, brand names, or other intellectual property mentioned or depicted on this site. Such intellectual property remains the property of its respective owners, and any references here are made solely for identification or informational purposes, without implying any affiliation, endorsement, or partnership.
We make no representations or warranties, express or implied, regarding the accuracy, completeness, or suitability of any content or products presented. Nothing on this website should be construed as legal, tax, investment, financial, medical, or other professional advice. In addition, no part of this site—including articles or product references—constitutes a solicitation, recommendation, endorsement, advertisement, or offer to buy or sell any securities, franchises, or other financial instruments, particularly in jurisdictions where such activity would be unlawful.
All content is of a general nature and may not address the specific circumstances of any individual or entity. It is not a substitute for professional advice or services. Any actions you take based on the information provided here are strictly at your own risk. You accept full responsibility for any decisions or outcomes arising from your use of this website and agree to release us from any liability in connection with your use of, or reliance upon, the content or products found herein.