
|
Guangzhou Sie Consulting Co., Ltd. (300687.SZ) Évaluation DCF |
Entièrement Modifiable: Adapté À Vos Besoins Dans Excel Ou Sheets
Conception Professionnelle: Modèles Fiables Et Conformes Aux Normes Du Secteur
Pré-Construits Pour Une Utilisation Rapide Et Efficace
Compatible MAC/PC, entièrement débloqué
Aucune Expertise N'Est Requise; Facile À Suivre
Guangzhou Sie Consulting Co., Ltd. (300687.SZ) Bundle
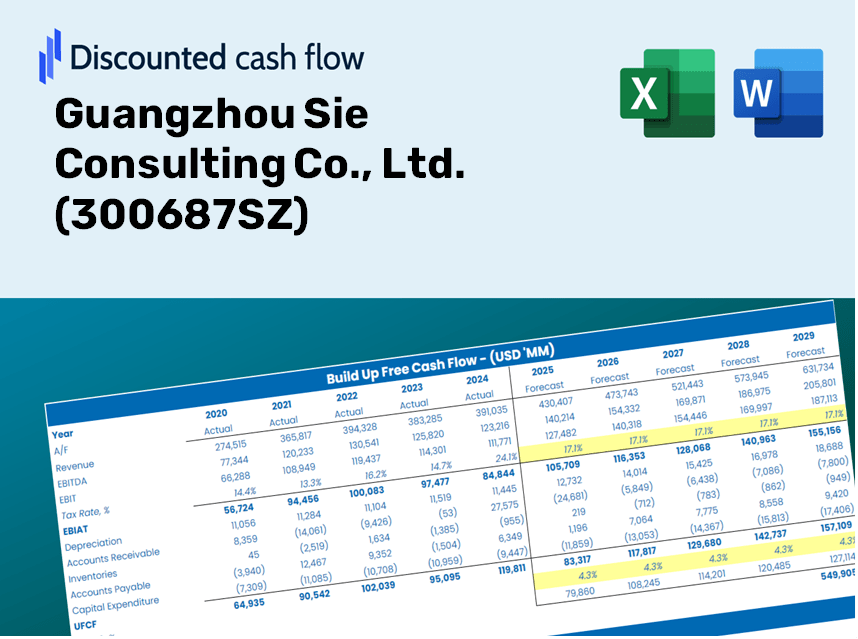
Gardez un aperçu de votre analyse d'évaluation de votre Guangzhou Sie Consulting Co., Ltd. (300687SZ) avec notre calculatrice DCF de pointe! Préchargé avec des données réelles (300687SZ), ce modèle Excel vous permet d'ajuster les prévisions et les hypothèses pour déterminer la valeur intrinsèque de Guangzhou Sie Consulting Co., Ltd. avec précision.
Discounted Cash Flow (DCF) - (USD MM)
| Year | AY1 2020 |
AY2 2021 |
AY3 2022 |
AY4 2023 |
AY5 2024 |
FY1 2025 |
FY2 2026 |
FY3 2027 |
FY4 2028 |
FY5 2029 |
|---|---|---|---|---|---|---|---|---|---|---|
| Revenue | 1,385.3 | 1,934.9 | 2,271.1 | 2,254.0 | 2,395.5 | 2,770.2 | 3,203.5 | 3,704.6 | 4,284.1 | 4,954.3 |
| Revenue Growth, % | 0 | 39.68 | 17.37 | -0.75258 | 6.27 | 15.64 | 15.64 | 15.64 | 15.64 | 15.64 |
| EBITDA | 179.0 | 246.5 | 256.0 | 213.6 | 133.9 | 288.1 | 333.2 | 385.3 | 445.5 | 515.2 |
| EBITDA, % | 12.92 | 12.74 | 11.27 | 9.47 | 5.59 | 10.4 | 10.4 | 10.4 | 10.4 | 10.4 |
| Depreciation | 2.1 | 12.2 | 30.6 | 40.6 | 22.4 | 27.0 | 31.2 | 36.1 | 41.7 | 48.2 |
| Depreciation, % | 0.15452 | 0.63107 | 1.35 | 1.8 | 0.93585 | 0.97333 | 0.97333 | 0.97333 | 0.97333 | 0.97333 |
| EBIT | 176.9 | 234.3 | 225.4 | 173.0 | 111.4 | 261.1 | 302.0 | 349.2 | 403.8 | 467.0 |
| EBIT, % | 12.77 | 12.11 | 9.93 | 7.68 | 4.65 | 9.43 | 9.43 | 9.43 | 9.43 | 9.43 |
| Total Cash | 613.7 | 1,161.8 | 1,066.5 | 829.6 | 524.5 | 1,163.5 | 1,345.5 | 1,556.0 | 1,799.4 | 2,080.9 |
| Total Cash, percent | .0 | .0 | .0 | .0 | .0 | .0 | .0 | .0 | .0 | .0 |
| Account Receivables | 553.8 | 681.4 | 854.3 | 1,018.9 | 1,358.8 | 1,189.7 | 1,375.8 | 1,591.0 | 1,839.9 | 2,127.7 |
| Account Receivables, % | 39.97 | 35.22 | 37.61 | 45.2 | 56.72 | 42.95 | 42.95 | 42.95 | 42.95 | 42.95 |
| Inventories | 98.6 | 123.8 | 118.7 | 149.7 | 161.2 | 177.9 | 205.8 | 238.0 | 275.2 | 318.2 |
| Inventories, % | 7.12 | 6.4 | 5.23 | 6.64 | 6.73 | 6.42 | 6.42 | 6.42 | 6.42 | 6.42 |
| Accounts Payable | 36.3 | 45.4 | 73.4 | 75.7 | 128.9 | 93.8 | 108.5 | 125.5 | 145.1 | 167.8 |
| Accounts Payable, % | 2.62 | 2.34 | 3.23 | 3.36 | 5.38 | 3.39 | 3.39 | 3.39 | 3.39 | 3.39 |
| Capital Expenditure | -243.8 | -197.4 | -198.4 | -151.0 | -251.3 | -297.7 | -344.3 | -398.1 | -460.4 | -532.4 |
| Capital Expenditure, % | -17.6 | -10.2 | -8.74 | -6.7 | -10.49 | -10.75 | -10.75 | -10.75 | -10.75 | -10.75 |
| Tax Rate, % | 1.22 | 1.22 | 1.22 | 1.22 | 1.22 | 1.22 | 1.22 | 1.22 | 1.22 | 1.22 |
| EBITAT | 164.8 | 219.6 | 222.4 | 179.2 | 110.1 | 252.9 | 292.5 | 338.3 | 391.2 | 452.4 |
| Depreciation | ||||||||||
| Changes in Account Receivables | ||||||||||
| Changes in Inventories | ||||||||||
| Changes in Accounts Payable | ||||||||||
| Capital Expenditure | ||||||||||
| UFCF | -692.9 | -109.5 | -85.2 | -124.6 | -416.9 | 99.5 | -219.8 | -254.2 | -294.0 | -340.0 |
| WACC, % | 5.08 | 5.08 | 5.09 | 5.09 | 5.09 | 5.09 | 5.09 | 5.09 | 5.09 | 5.09 |
| PV UFCF | ||||||||||
| SUM PV UFCF | -829.8 | |||||||||
| Long Term Growth Rate, % | 4.00 | |||||||||
| Free cash flow (T + 1) | -354 | |||||||||
| Terminal Value | -32,570 | |||||||||
| Present Terminal Value | -25,415 | |||||||||
| Enterprise Value | -26,245 | |||||||||
| Net Debt | -33 | |||||||||
| Equity Value | -26,212 | |||||||||
| Diluted Shares Outstanding, MM | 406 | |||||||||
| Equity Value Per Share | -64.56 |
Benefits You Will Enjoy
- Comprehensive Financial Model: Utilize Guangzhou Sie Consulting Co., Ltd.'s actual data for accurate DCF valuation.
- Complete Forecast Control: Modify revenue growth, profit margins, WACC, and other essential metrics.
- Real-Time Calculations: Automatic updates provide instant visibility of results as adjustments are made.
- Professional-Grade Template: An expertly crafted Excel file specifically designed for valuation purposes.
- Flexible and Reusable: Customizable to suit your needs, allowing for repeated use in detailed forecasting.
Key Features
- 🔍 Real-Time [Symbol] Financials: Access pre-filled historical and projected data for Guangzhou Sie Consulting Co., Ltd.
- ✏️ Fully Customizable Parameters: Modify all crucial inputs (yellow cells) such as WACC, growth %, and tax rates.
- 📊 Comprehensive DCF Valuation: Integrated formulas calculate the intrinsic value of [Symbol] using the Discounted Cash Flow approach.
- ⚡ Immediate Feedback: View [Symbol]’s valuation instantly after making adjustments.
- Scenario Analysis: Evaluate and compare results for different financial assumptions side-by-side.
How It Works
- Step 1: Download the Excel file.
- Step 2: Examine Guangzhou Sie Consulting Co., Ltd.'s pre-filled financial data and projections.
- Step 3: Adjust key inputs such as revenue growth, WACC, and tax rates (highlighted cells).
- Step 4: Observe the DCF model refresh in real-time as you alter your assumptions.
- Step 5: Evaluate the outcomes and utilize the findings for your investment strategies.
Reasons to Choose This Calculator for Guangzhou Sie Consulting Co., Ltd. (300687SZ)
- Precision: Utilizes actual financial data from Guangzhou Sie Consulting to ensure accuracy.
- Customizable: Tailored for users to easily adjust and test various inputs.
- Efficiency: Avoid the complexity of constructing a DCF model from the ground up.
- Expert-Level: Built with the meticulousness and functionality expected by CFOs.
- Accessible: Designed for simplicity, making it suitable for users without extensive financial modeling skills.
Who Can Benefit from Our Services?
- Professional Investors: Develop precise and dependable valuation models for thorough portfolio evaluation.
- Corporate Finance Teams: Assess valuation scenarios to inform strategic decisions within the organization.
- Consultants and Advisors: Deliver clients accurate valuation insights regarding Guangzhou Sie Consulting Co., Ltd. (300687SZ).
- Students and Educators: Leverage real-world data to enhance learning and practice in financial modeling.
- Business Enthusiasts: Gain insights into how companies like Guangzhou Sie Consulting Co., Ltd. (300687SZ) are valued in the marketplace.
Contents of the Template
- Historical Data: Contains Guangzhou Sie Consulting Co., Ltd.'s (300687SZ) previous financial performance and foundational forecasts.
- DCF and Levered DCF Models: Comprehensive templates designed to assess the intrinsic value of Guangzhou Sie Consulting Co., Ltd. (300687SZ).
- WACC Sheet: Pre-configured calculations for the Weighted Average Cost of Capital.
- Editable Inputs: Customize essential parameters such as growth rates, EBITDA percentages, and capital expenditure assumptions.
- Quarterly and Annual Statements: An extensive analysis of the financial data for Guangzhou Sie Consulting Co., Ltd. (300687SZ).
- Interactive Dashboard: A dynamic platform to visualize valuation outcomes and future projections.
Disclaimer
All information, articles, and product details provided on this website are for general informational and educational purposes only. We do not claim any ownership over, nor do we intend to infringe upon, any trademarks, copyrights, logos, brand names, or other intellectual property mentioned or depicted on this site. Such intellectual property remains the property of its respective owners, and any references here are made solely for identification or informational purposes, without implying any affiliation, endorsement, or partnership.
We make no representations or warranties, express or implied, regarding the accuracy, completeness, or suitability of any content or products presented. Nothing on this website should be construed as legal, tax, investment, financial, medical, or other professional advice. In addition, no part of this site—including articles or product references—constitutes a solicitation, recommendation, endorsement, advertisement, or offer to buy or sell any securities, franchises, or other financial instruments, particularly in jurisdictions where such activity would be unlawful.
All content is of a general nature and may not address the specific circumstances of any individual or entity. It is not a substitute for professional advice or services. Any actions you take based on the information provided here are strictly at your own risk. You accept full responsibility for any decisions or outcomes arising from your use of this website and agree to release us from any liability in connection with your use of, or reliance upon, the content or products found herein.