
|
Dark Horse Technology Group Co., Ltd. (300688.SZ) Évaluation DCF |
Entièrement Modifiable: Adapté À Vos Besoins Dans Excel Ou Sheets
Conception Professionnelle: Modèles Fiables Et Conformes Aux Normes Du Secteur
Pré-Construits Pour Une Utilisation Rapide Et Efficace
Compatible MAC/PC, entièrement débloqué
Aucune Expertise N'Est Requise; Facile À Suivre
Dark Horse Technology Group Co., Ltd. (300688.SZ) Bundle
Simplify Dark Horse Technology Group Co., Ltd. (300688SZ) Valation avec cette calculatrice DCF personnalisable! Doté de Real Dark Horse Technology Group Co., Ltd. (300688SZ) Financials and Rajuscable Prévisions, vous pouvez tester des scénarios et découvrir la juste valeur de Dark Horse Technology Group Co., Ltd. (300688SZ).
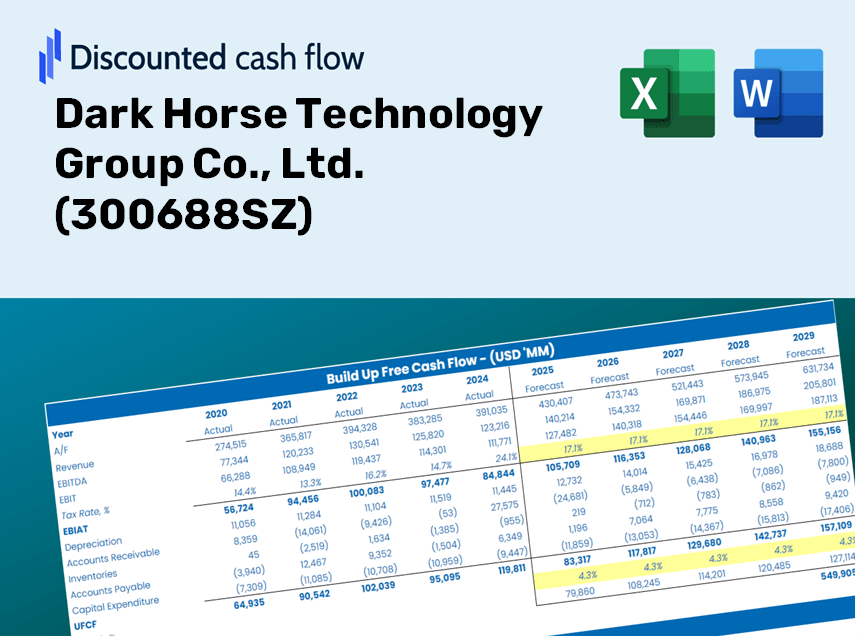
Discounted Cash Flow (DCF) - (USD MM)
| Year | AY1 2020 |
AY2 2021 |
AY3 2022 |
AY4 2023 |
AY5 2024 |
FY1 2025 |
FY2 2026 |
FY3 2027 |
FY4 2028 |
FY5 2029 |
|---|---|---|---|---|---|---|---|---|---|---|
| Revenue | 163.5 | 339.9 | 347.1 | 271.0 | 221.9 | 256.4 | 296.2 | 342.2 | 395.3 | 456.6 |
| Revenue Growth, % | 0 | 107.87 | 2.13 | -21.92 | -18.12 | 15.52 | 15.52 | 15.52 | 15.52 | 15.52 |
| EBITDA | 20.7 | 11.6 | -79.7 | 30.9 | -86.0 | -17.5 | -20.3 | -23.4 | -27.1 | -31.3 |
| EBITDA, % | 12.65 | 3.41 | -22.95 | 11.41 | -38.74 | -6.85 | -6.85 | -6.85 | -6.85 | -6.85 |
| Depreciation | 10.6 | 24.6 | 34.7 | 31.2 | 31.1 | 25.3 | 29.2 | 33.7 | 38.9 | 45.0 |
| Depreciation, % | 6.46 | 7.24 | 10 | 11.52 | 14.02 | 9.85 | 9.85 | 9.85 | 9.85 | 9.85 |
| EBIT | 10.1 | -13.0 | -114.4 | -.3 | -117.1 | -42.8 | -49.4 | -57.1 | -66.0 | -76.2 |
| EBIT, % | 6.18 | -3.83 | -32.95 | -0.11267 | -52.76 | -16.7 | -16.7 | -16.7 | -16.7 | -16.7 |
| Total Cash | 293.8 | 494.9 | 443.1 | 406.0 | 340.9 | 256.4 | 296.2 | 342.2 | 395.3 | 456.6 |
| Total Cash, percent | .0 | .0 | .0 | .0 | .0 | .0 | .0 | .0 | .0 | .0 |
| Account Receivables | 71.9 | .0 | .0 | .0 | 32.0 | 29.9 | 34.6 | 40.0 | 46.2 | 53.3 |
| Account Receivables, % | 43.99 | 0 | 0 | 0 | 14.42 | 11.68 | 11.68 | 11.68 | 11.68 | 11.68 |
| Inventories | 1.4 | 5.4 | 2.9 | .0 | .0 | 1.7 | 2.0 | 2.3 | 2.6 | 3.0 |
| Inventories, % | 0.86248 | 1.59 | 0.84944 | 0 | 0 | 0.65956 | 0.65956 | 0.65956 | 0.65956 | 0.65956 |
| Accounts Payable | 14.3 | 25.9 | 33.0 | 43.6 | 53.5 | 33.9 | 39.1 | 45.2 | 52.2 | 60.3 |
| Accounts Payable, % | 8.74 | 7.61 | 9.5 | 16.1 | 24.12 | 13.21 | 13.21 | 13.21 | 13.21 | 13.21 |
| Capital Expenditure | -5.6 | -25.5 | -26.4 | -19.9 | -7.9 | -15.1 | -17.4 | -20.2 | -23.3 | -26.9 |
| Capital Expenditure, % | -3.45 | -7.51 | -7.6 | -7.33 | -3.56 | -5.89 | -5.89 | -5.89 | -5.89 | -5.89 |
| Tax Rate, % | 10.51 | 10.51 | 10.51 | 10.51 | 10.51 | 10.51 | 10.51 | 10.51 | 10.51 | 10.51 |
| EBITAT | 7.7 | 32.7 | -86.1 | -.3 | -104.8 | -28.2 | -32.6 | -37.7 | -43.5 | -50.3 |
| Depreciation | ||||||||||
| Changes in Account Receivables | ||||||||||
| Changes in Inventories | ||||||||||
| Changes in Accounts Payable | ||||||||||
| Capital Expenditure | ||||||||||
| UFCF | -46.4 | 111.3 | -68.2 | 24.7 | -103.7 | -37.4 | -20.6 | -23.7 | -27.4 | -31.7 |
| WACC, % | 6.84 | 6.82 | 6.84 | 6.85 | 6.85 | 6.84 | 6.84 | 6.84 | 6.84 | 6.84 |
| PV UFCF | ||||||||||
| SUM PV UFCF | -116.3 | |||||||||
| Long Term Growth Rate, % | 2.00 | |||||||||
| Free cash flow (T + 1) | -32 | |||||||||
| Terminal Value | -668 | |||||||||
| Present Terminal Value | -480 | |||||||||
| Enterprise Value | -596 | |||||||||
| Net Debt | -334 | |||||||||
| Equity Value | -262 | |||||||||
| Diluted Shares Outstanding, MM | 162 | |||||||||
| Equity Value Per Share | -1.62 |
What You Will Receive
- Accurate DHT Financials: Access to historical and projected data for precise valuations.
- Customizable Parameters: Adjust WACC, tax rates, revenue growth, and capital investments.
- Automated Calculations: Intrinsic value and NPV computed in real-time.
- Scenario Modeling: Explore various scenarios to assess Dark Horse Technology Group’s future prospects.
- User-Friendly Interface: Designed for industry professionals while remaining approachable for newcomers.
Highlighted Features
- Customizable Financial Metrics: Adjust essential inputs such as revenue growth, EBITDA margin, and capital expenditure levels.
- Instant DCF Valuation: Produces intrinsic value, NPV, and various other financial outputs in real-time.
- High-Precision Accuracy: Leverages Dark Horse Technology Group Co., Ltd.'s (300688SZ) actual financial data for realistic valuation results.
- Streamlined Scenario Analysis: Effortlessly test diverse assumptions and evaluate different outcomes.
- Efficient Valuation Tool: Removes the necessity of constructing intricate valuation models from the ground up.
How It Functions
- Step 1: Download the Excel spreadsheet.
- Step 2: Examine the pre-loaded data for Dark Horse Technology Group Co., Ltd. (300688SZ) (historical and forecasted).
- Step 3: Modify key assumptions (highlighted in yellow) according to your analysis.
- Step 4: Observe automatic recalculations for the intrinsic value of Dark Horse Technology Group Co., Ltd. (300688SZ).
- Step 5: Utilize the results for investment strategies or reporting purposes.
Why Choose Dark Horse Technology Group Co., Ltd. (300688SZ) Calculator?
- All-in-One Solution: Offers DCF, WACC, and financial ratio assessments in a single, user-friendly package.
- Tailored Inputs: Easily modify the highlighted cells to explore different scenarios and outcomes.
- In-Depth Analysis: Automatically determines Dark Horse Technology's intrinsic value and Net Present Value.
- Preloaded Information: Access to historical and projected data for reliable analysis.
- High-Quality Standards: Perfect for financial analysts, investors, and business consultants seeking accurate insights.
Who Can Benefit from Dark Horse Technology Group Co., Ltd. (300688SZ)?
- Individual Investors: Gain insights to make informed decisions about investing in Dark Horse Technology Group (300688SZ).
- Financial Analysts: Enhance valuation efforts with comprehensive financial models tailored for Dark Horse Technology Group (300688SZ).
- Consultants: Provide clients with accurate and timely valuation analyses of Dark Horse Technology Group (300688SZ).
- Business Owners: Learn from the valuation methods of a leading company like Dark Horse Technology Group (300688SZ) to inform your own business strategies.
- Finance Students: Explore valuation principles using practical examples drawn from Dark Horse Technology Group (300688SZ).
Contents of the Template
- Pre-Filled DCF Model: Dark Horse Technology Group Co., Ltd.'s financial data preloaded for immediate application.
- WACC Calculator: Comprehensive calculations for Weighted Average Cost of Capital.
- Financial Ratios: Analyze the profitability, leverage, and efficiency of Dark Horse Technology Group Co., Ltd.
- Editable Inputs: Modify parameters such as growth rates, margins, and CAPEX to suit your scenarios.
- Financial Statements: Annual and quarterly reports for in-depth analysis.
- Interactive Dashboard: Effortlessly visualize key valuation metrics and outcomes.
Disclaimer
All information, articles, and product details provided on this website are for general informational and educational purposes only. We do not claim any ownership over, nor do we intend to infringe upon, any trademarks, copyrights, logos, brand names, or other intellectual property mentioned or depicted on this site. Such intellectual property remains the property of its respective owners, and any references here are made solely for identification or informational purposes, without implying any affiliation, endorsement, or partnership.
We make no representations or warranties, express or implied, regarding the accuracy, completeness, or suitability of any content or products presented. Nothing on this website should be construed as legal, tax, investment, financial, medical, or other professional advice. In addition, no part of this site—including articles or product references—constitutes a solicitation, recommendation, endorsement, advertisement, or offer to buy or sell any securities, franchises, or other financial instruments, particularly in jurisdictions where such activity would be unlawful.
All content is of a general nature and may not address the specific circumstances of any individual or entity. It is not a substitute for professional advice or services. Any actions you take based on the information provided here are strictly at your own risk. You accept full responsibility for any decisions or outcomes arising from your use of this website and agree to release us from any liability in connection with your use of, or reliance upon, the content or products found herein.