
|
Wuhan Raycus Fiber Laser Technologies Co., Ltd. (300747.SZ) Évaluation DCF |
Entièrement Modifiable: Adapté À Vos Besoins Dans Excel Ou Sheets
Conception Professionnelle: Modèles Fiables Et Conformes Aux Normes Du Secteur
Pré-Construits Pour Une Utilisation Rapide Et Efficace
Compatible MAC/PC, entièrement débloqué
Aucune Expertise N'Est Requise; Facile À Suivre
Wuhan Raycus Fiber Laser Technologies Co.,Ltd. (300747.SZ) Bundle
Explorez les perspectives financières de Wuhan Raycus Fiber Laser Technologies Co., Ltd. avec notre calculatrice DCF conviviale! Entrez vos hypothèses de croissance, de marges et de dépenses pour calculer la valeur intrinsèque de Wuhan Raycus Fiber Laser Technologies Co., Ltd. et améliorez votre stratégie d'investissement.
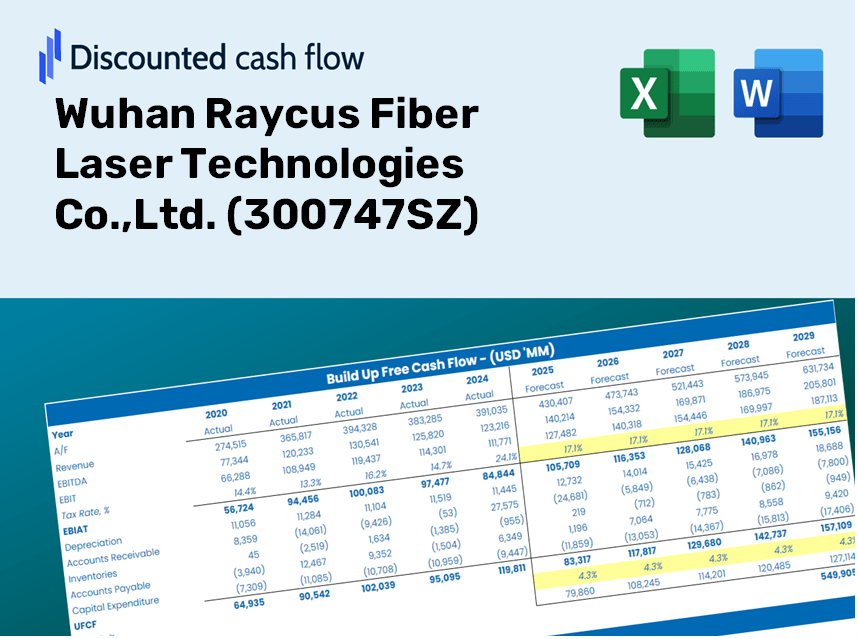
Discounted Cash Flow (DCF) - (USD MM)
| Year | AY1 2020 |
AY2 2021 |
AY3 2022 |
AY4 2023 |
AY5 2024 |
FY1 2025 |
FY2 2026 |
FY3 2027 |
FY4 2028 |
FY5 2029 |
|---|---|---|---|---|---|---|---|---|---|---|
| Revenue | 2,316.6 | 3,409.6 | 3,188.7 | 3,679.7 | 3,197.3 | 3,540.9 | 3,921.5 | 4,342.9 | 4,809.7 | 5,326.5 |
| Revenue Growth, % | 0 | 47.18 | -6.48 | 15.4 | -13.11 | 10.75 | 10.75 | 10.75 | 10.75 | 10.75 |
| EBITDA | 361.7 | 575.4 | 94.0 | 313.6 | 164.0 | 347.6 | 385.0 | 426.4 | 472.2 | 522.9 |
| EBITDA, % | 15.61 | 16.88 | 2.95 | 8.52 | 5.13 | 9.82 | 9.82 | 9.82 | 9.82 | 9.82 |
| Depreciation | 63.6 | 78.9 | 110.9 | 148.7 | 159.8 | 124.5 | 137.9 | 152.7 | 169.1 | 187.3 |
| Depreciation, % | 2.75 | 2.32 | 3.48 | 4.04 | 5 | 3.52 | 3.52 | 3.52 | 3.52 | 3.52 |
| EBIT | 298.1 | 496.4 | -16.9 | 164.9 | 4.2 | 223.1 | 247.1 | 273.7 | 303.1 | 335.7 |
| EBIT, % | 12.87 | 14.56 | -0.53071 | 4.48 | 0.13031 | 6.3 | 6.3 | 6.3 | 6.3 | 6.3 |
| Total Cash | 832.7 | 454.5 | 773.5 | 933.7 | 975.1 | 916.4 | 1,014.9 | 1,124.0 | 1,244.8 | 1,378.6 |
| Total Cash, percent | .0 | .0 | .0 | .0 | .0 | .0 | .0 | .0 | .0 | .0 |
| Account Receivables | 1,597.4 | 1,772.7 | 1,885.7 | 2,118.5 | 1,858.4 | 2,094.7 | 2,319.8 | 2,569.1 | 2,845.2 | 3,151.0 |
| Account Receivables, % | 68.95 | 51.99 | 59.14 | 57.57 | 58.12 | 59.16 | 59.16 | 59.16 | 59.16 | 59.16 |
| Inventories | 600.3 | 1,141.2 | 1,107.9 | 1,025.5 | 785.3 | 1,037.9 | 1,149.5 | 1,273.0 | 1,409.8 | 1,561.3 |
| Inventories, % | 25.91 | 33.47 | 34.75 | 27.87 | 24.56 | 29.31 | 29.31 | 29.31 | 29.31 | 29.31 |
| Accounts Payable | 524.9 | 406.1 | 498.9 | 1,396.8 | 1,016.0 | 849.5 | 940.8 | 1,041.9 | 1,153.9 | 1,277.9 |
| Accounts Payable, % | 22.66 | 11.91 | 15.65 | 37.96 | 31.78 | 23.99 | 23.99 | 23.99 | 23.99 | 23.99 |
| Capital Expenditure | -260.0 | -429.5 | -374.5 | -172.3 | -106.8 | -308.7 | -341.8 | -378.6 | -419.2 | -464.3 |
| Capital Expenditure, % | -11.22 | -12.6 | -11.74 | -4.68 | -3.34 | -8.72 | -8.72 | -8.72 | -8.72 | -8.72 |
| Tax Rate, % | -10.3 | -10.3 | -10.3 | -10.3 | -10.3 | -10.3 | -10.3 | -10.3 | -10.3 | -10.3 |
| EBITAT | 251.2 | 424.9 | -59.5 | 154.0 | 4.6 | 206.7 | 229.0 | 253.6 | 280.8 | 311.0 |
| Depreciation | ||||||||||
| Changes in Account Receivables | ||||||||||
| Changes in Inventories | ||||||||||
| Changes in Accounts Payable | ||||||||||
| Capital Expenditure | ||||||||||
| UFCF | -1,618.0 | -760.4 | -310.1 | 877.9 | 177.1 | -632.8 | -220.4 | -244.1 | -270.3 | -299.3 |
| WACC, % | 6.82 | 6.82 | 6.83 | 6.83 | 6.83 | 6.83 | 6.83 | 6.83 | 6.83 | 6.83 |
| PV UFCF | ||||||||||
| SUM PV UFCF | -1,408.3 | |||||||||
| Long Term Growth Rate, % | 4.00 | |||||||||
| Free cash flow (T + 1) | -311 | |||||||||
| Terminal Value | -11,007 | |||||||||
| Present Terminal Value | -7,911 | |||||||||
| Enterprise Value | -9,319 | |||||||||
| Net Debt | -724 | |||||||||
| Equity Value | -8,595 | |||||||||
| Diluted Shares Outstanding, MM | 562 | |||||||||
| Equity Value Per Share | -15.31 |
What You Will Receive
- Authentic Raycus Data: Comprehensive financials – including revenue and EBIT – derived from actual and forecasted figures.
- Complete Customization: Modify all essential parameters (yellow cells) such as WACC, growth rate, and tax percentages.
- Immediate Valuation Adjustments: Automatic recalculations to evaluate the effects of changes on Wuhan Raycus' fair value.
- Flexible Excel Template: Designed for quick modifications, scenario analysis, and in-depth projections.
- Efficient and Precise: Avoid the hassle of constructing models from the ground up while ensuring accuracy and adaptability.
Key Features
- 🔍 Real-Life Raycus Financials: Pre-filled historical and projected data for Wuhan Raycus Fiber Laser Technologies Co.,Ltd. (300747SZ).
- ✏️ Fully Customizable Inputs: Modify essential parameters (yellow cells) such as WACC, growth %, and tax rates.
- 📊 Professional DCF Valuation: Integrated formulas to determine Raycus's intrinsic value using the Discounted Cash Flow approach.
- ⚡ Instant Results: Get immediate visual feedback on Raycus's valuation after any adjustments.
- Scenario Analysis: Evaluate and compare the effects of different financial assumptions side-by-side.
How It Operates
- Download the Template: Gain immediate access to the Excel-based Raycus DCF Calculator for Wuhan Raycus Fiber Laser Technologies Co., Ltd. (300747SZ).
- Input Your Assumptions: Modify the yellow-highlighted cells for growth rates, WACC, profit margins, and additional variables.
- Instant Calculations: The model will automatically calculate the intrinsic value of Wuhan Raycus Fiber Laser Technologies Co., Ltd. (300747SZ).
- Test Scenarios: Experiment with various assumptions to assess potential changes in valuation.
- Analyze and Decide: Utilize the findings to inform your investment strategy or financial assessments.
Why Opt for Raycus Fiber Laser Technologies?
- Precision: Utilizing authentic financial data for unmatched accuracy.
- Versatility: Crafted to allow users to explore and adjust parameters effortlessly.
- Efficiency: Eliminate the need to construct a financial model from the ground up.
- Expert-Level: Engineered with the precision and functionality expected at a CFO's level.
- Intuitive: Designed for ease of use, even for those new to financial modeling.
Who Should Utilize This Product?
- Investors: Precisely assess Wuhan Raycus Fiber Laser Technologies Co., Ltd.’s (300747SZ) fair value prior to making investment choices.
- CFOs: Utilize a top-tier DCF model for financial analysis and reporting.
- Consultants: Efficiently customize the template for client valuation reports.
- Entrepreneurs: Acquire insights into financial modeling practices employed by leading companies.
- Educators: Employ it as a teaching resource to illustrate valuation techniques.
Contents of the Template
- Pre-Filled Data: Contains Wuhan Raycus Fiber Laser Technologies Co., Ltd.'s historical financials and projections.
- Discounted Cash Flow Model: An editable DCF valuation model that features automatic calculations.
- Weighted Average Cost of Capital (WACC): A specialized sheet for computing WACC using tailored inputs.
- Key Financial Ratios: Evaluate Wuhan Raycus's profitability, efficiency, and leverage metrics.
- Customizable Inputs: Easily modify revenue growth, profit margins, and tax rates.
- Clear Dashboard: Visual representations and tables summarizing essential valuation outcomes.
Disclaimer
All information, articles, and product details provided on this website are for general informational and educational purposes only. We do not claim any ownership over, nor do we intend to infringe upon, any trademarks, copyrights, logos, brand names, or other intellectual property mentioned or depicted on this site. Such intellectual property remains the property of its respective owners, and any references here are made solely for identification or informational purposes, without implying any affiliation, endorsement, or partnership.
We make no representations or warranties, express or implied, regarding the accuracy, completeness, or suitability of any content or products presented. Nothing on this website should be construed as legal, tax, investment, financial, medical, or other professional advice. In addition, no part of this site—including articles or product references—constitutes a solicitation, recommendation, endorsement, advertisement, or offer to buy or sell any securities, franchises, or other financial instruments, particularly in jurisdictions where such activity would be unlawful.
All content is of a general nature and may not address the specific circumstances of any individual or entity. It is not a substitute for professional advice or services. Any actions you take based on the information provided here are strictly at your own risk. You accept full responsibility for any decisions or outcomes arising from your use of this website and agree to release us from any liability in connection with your use of, or reliance upon, the content or products found herein.