
|
Robotechnik Intelligent Technology Co., Ltd (300757.SZ) Évaluation DCF |
Entièrement Modifiable: Adapté À Vos Besoins Dans Excel Ou Sheets
Conception Professionnelle: Modèles Fiables Et Conformes Aux Normes Du Secteur
Pré-Construits Pour Une Utilisation Rapide Et Efficace
Compatible MAC/PC, entièrement débloqué
Aucune Expertise N'Est Requise; Facile À Suivre
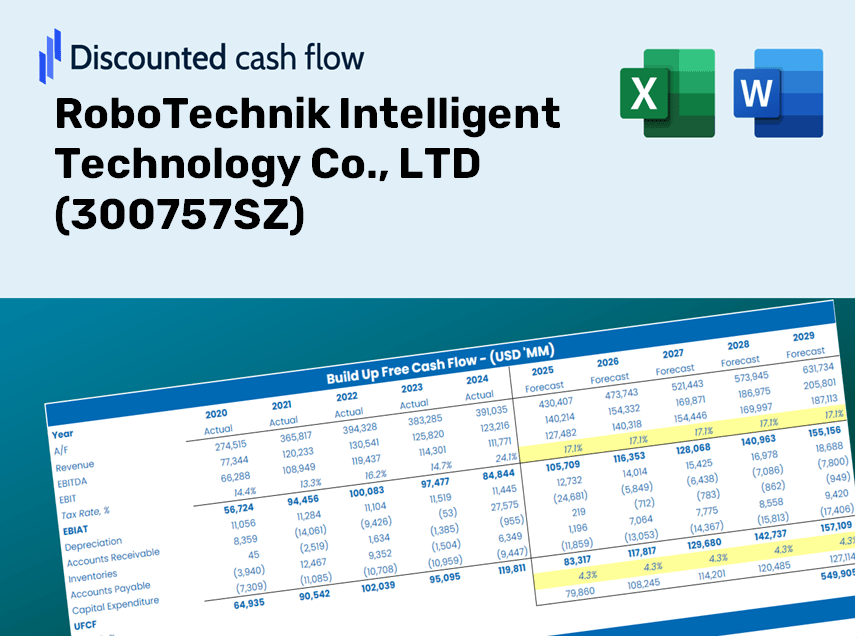
RoboTechnik Intelligent Technology Co., LTD (300757.SZ) Bundle
Améliorez vos stratégies d'investissement avec la calculatrice DCF (300757SZ)! Explorez des données financières précises pour Robotechnik Intelligent Technology Co., Ltd, ajustez les projections et dépenses de croissance et observez instantanément comment ces changements affectent la valeur intrinsèque de l'entreprise.
Discounted Cash Flow (DCF) - (USD MM)
| Year | AY1 2020 |
AY2 2021 |
AY3 2022 |
AY4 2023 |
AY5 2024 |
FY1 2025 |
FY2 2026 |
FY3 2027 |
FY4 2028 |
FY5 2029 |
|---|---|---|---|---|---|---|---|---|---|---|
| Revenue | 528.2 | 1,086.0 | 903.2 | 1,571.5 | 1,106.3 | 1,459.1 | 1,924.4 | 2,538.2 | 3,347.6 | 4,415.2 |
| Revenue Growth, % | 0 | 105.58 | -16.83 | 74 | -29.6 | 31.89 | 31.89 | 31.89 | 31.89 | 31.89 |
| EBITDA | -87.4 | -20.2 | 70.2 | 121.0 | 98.7 | 17.5 | 23.1 | 30.4 | 40.1 | 52.9 |
| EBITDA, % | -16.54 | -1.86 | 7.77 | 7.7 | 8.92 | 1.2 | 1.2 | 1.2 | 1.2 | 1.2 |
| Depreciation | 11.1 | 21.4 | 32.5 | 29.8 | 23.1 | 34.0 | 44.8 | 59.1 | 78.0 | 102.9 |
| Depreciation, % | 2.09 | 1.97 | 3.6 | 1.89 | 2.09 | 2.33 | 2.33 | 2.33 | 2.33 | 2.33 |
| EBIT | -98.4 | -41.6 | 37.6 | 91.2 | 75.6 | -16.5 | -21.8 | -28.7 | -37.9 | -50.0 |
| EBIT, % | -18.63 | -3.83 | 4.17 | 5.8 | 6.83 | -1.13 | -1.13 | -1.13 | -1.13 | -1.13 |
| Total Cash | 161.6 | 245.9 | 232.1 | 238.8 | 315.1 | 357.8 | 471.9 | 622.4 | 820.9 | 1,082.7 |
| Total Cash, percent | .0 | .0 | .0 | .0 | .0 | .0 | .0 | .0 | .0 | .0 |
| Account Receivables | 633.8 | 719.0 | 689.0 | 929.9 | 1,001.1 | 1,144.4 | 1,509.3 | 1,990.7 | 2,625.5 | 3,462.8 |
| Account Receivables, % | 119.97 | 66.21 | 76.28 | 59.17 | 90.49 | 78.43 | 78.43 | 78.43 | 78.43 | 78.43 |
| Inventories | 407.9 | 313.0 | 510.0 | 500.6 | 205.2 | 621.3 | 819.4 | 1,080.8 | 1,425.4 | 1,880.0 |
| Inventories, % | 77.22 | 28.82 | 56.46 | 31.86 | 18.55 | 42.58 | 42.58 | 42.58 | 42.58 | 42.58 |
| Accounts Payable | 454.8 | 393.3 | 569.1 | 476.9 | 197.0 | 681.3 | 898.5 | 1,185.1 | 1,563.0 | 2,061.5 |
| Accounts Payable, % | 86.09 | 36.21 | 63.01 | 30.34 | 17.81 | 46.69 | 46.69 | 46.69 | 46.69 | 46.69 |
| Capital Expenditure | -80.1 | -108.7 | -24.6 | -8.6 | -25.0 | -89.6 | -118.2 | -155.9 | -205.6 | -271.1 |
| Capital Expenditure, % | -15.16 | -10.01 | -2.72 | -0.5445 | -2.26 | -6.14 | -6.14 | -6.14 | -6.14 | -6.14 |
| Tax Rate, % | -5.72 | -5.72 | -5.72 | -5.72 | -5.72 | -5.72 | -5.72 | -5.72 | -5.72 | -5.72 |
| EBITAT | -80.0 | -35.5 | 35.1 | 85.5 | 79.9 | -15.0 | -19.8 | -26.1 | -34.4 | -45.4 |
| Depreciation | ||||||||||
| Changes in Account Receivables | ||||||||||
| Changes in Inventories | ||||||||||
| Changes in Accounts Payable | ||||||||||
| Capital Expenditure | ||||||||||
| UFCF | -735.9 | -174.7 | 51.9 | -216.9 | 22.4 | -145.7 | -438.9 | -578.9 | -763.5 | -1,007.0 |
| WACC, % | 6.39 | 6.4 | 6.4 | 6.4 | 6.41 | 6.4 | 6.4 | 6.4 | 6.4 | 6.4 |
| PV UFCF | ||||||||||
| SUM PV UFCF | -2,339.4 | |||||||||
| Long Term Growth Rate, % | 2.00 | |||||||||
| Free cash flow (T + 1) | -1,027 | |||||||||
| Terminal Value | -23,335 | |||||||||
| Present Terminal Value | -17,110 | |||||||||
| Enterprise Value | -19,450 | |||||||||
| Net Debt | 662 | |||||||||
| Equity Value | -20,112 | |||||||||
| Diluted Shares Outstanding, MM | 156 | |||||||||
| Equity Value Per Share | -129.07 |
What You Will Receive
- Authentic 300757SZ Financials: Comprehensive historical and projected data for precise valuation.
- Customizable Inputs: Adjust WACC, tax rates, revenue growth, and capital expenditures as needed.
- Dynamic Calculations: Intrinsic value and NPV are computed in real-time.
- Scenario Analysis: Explore various scenarios to assess RoboTechnik’s future performance.
- User-Friendly Design: Designed for industry professionals while remaining accessible to newcomers.
Key Features
- Advanced DCF Calculator: Offers comprehensive unlevered and levered DCF valuation models tailored for RoboTechnik Intelligent Technology Co., LTD (300757SZ).
- WACC Calculator: Features a pre-configured Weighted Average Cost of Capital sheet with adjustable inputs specific to the needs of RoboTechnik Intelligent Technology Co., LTD (300757SZ).
- Editable Forecast Assumptions: Allows for the adjustment of growth rates, capital expenditures, and discount rates to fit RoboTechnik's strategic objectives.
- Built-In Financial Ratios: Evaluate profitability, leverage, and efficiency ratios relevant to RoboTechnik Intelligent Technology Co., LTD (300757SZ).
- Dashboard and Charts: Provides visual representations that summarize essential valuation metrics for simplified analysis of RoboTechnik Intelligent Technology Co., LTD (300757SZ).
How It Functions
- Download the Template: Gain immediate access to the Excel-based RoboTechnik DCF Calculator for (300757SZ).
- Input Your Assumptions: Modify the yellow-highlighted cells for growth rates, WACC, profit margins, and additional variables.
- Instant Calculations: The model automatically recalculates the intrinsic value of RoboTechnik.
- Test Scenarios: Explore various assumptions to assess potential changes in valuation.
- Analyze and Decide: Utilize the outcomes to inform your investment or financial decisions.
Why Opt for RoboTechnik's Calculator?
- Precise Financial Insights: Utilize accurate data from RoboTechnik (300757SZ) for dependable valuation assessments.
- Fully Customizable: Tailor essential parameters such as growth projections, WACC, and tax rates to fit your analysis.
- Efficiency Boost: Ready-to-use calculations save time, allowing you to focus on strategic decision-making.
- Expert-Level Resource: Crafted for investors, analysts, and consultants navigating the tech landscape.
- Accessible Interface: User-friendly design with clear instructions ensures a seamless experience for everyone.
Who Should Utilize This Product?
- Individual Investors: Make well-informed choices regarding the buying or selling of RoboTechnik Intelligent Technology Co., LTD (300757SZ) shares.
- Financial Analysts: Enhance valuation processes with pre-built financial models tailored to RoboTechnik (300757SZ).
- Consultants: Provide clients with timely and precise valuation insights related to RoboTechnik (300757SZ).
- Business Owners: Gain insights into how major companies like RoboTechnik (300757SZ) are valued to shape your own strategic decisions.
- Finance Students: Explore valuation methods using real-life data and scenarios from RoboTechnik (300757SZ).
Components of the Template
- Advanced DCF Model: Customizable template featuring intricate valuation calculations.
- Real-Time Data: RoboTechnik's historical and projected financial figures preloaded for in-depth analysis.
- Adjustable Parameters: Modify WACC, growth rates, and tax assumptions to explore various scenarios.
- Comprehensive Financial Statements: Detailed annual and quarterly reports for enhanced understanding.
- Essential Ratios: Integrated analysis for assessing profitability, efficiency, and leverage.
- Interactive Dashboard with Visual Outputs: Graphs and tables for presenting clear, actionable insights.
Disclaimer
All information, articles, and product details provided on this website are for general informational and educational purposes only. We do not claim any ownership over, nor do we intend to infringe upon, any trademarks, copyrights, logos, brand names, or other intellectual property mentioned or depicted on this site. Such intellectual property remains the property of its respective owners, and any references here are made solely for identification or informational purposes, without implying any affiliation, endorsement, or partnership.
We make no representations or warranties, express or implied, regarding the accuracy, completeness, or suitability of any content or products presented. Nothing on this website should be construed as legal, tax, investment, financial, medical, or other professional advice. In addition, no part of this site—including articles or product references—constitutes a solicitation, recommendation, endorsement, advertisement, or offer to buy or sell any securities, franchises, or other financial instruments, particularly in jurisdictions where such activity would be unlawful.
All content is of a general nature and may not address the specific circumstances of any individual or entity. It is not a substitute for professional advice or services. Any actions you take based on the information provided here are strictly at your own risk. You accept full responsibility for any decisions or outcomes arising from your use of this website and agree to release us from any liability in connection with your use of, or reliance upon, the content or products found herein.