
|
Shenzhen Mindray Bio-Medical Electronics Co., Ltd. (300760.SZ) Valation DCF |
Entièrement Modifiable: Adapté À Vos Besoins Dans Excel Ou Sheets
Conception Professionnelle: Modèles Fiables Et Conformes Aux Normes Du Secteur
Pré-Construits Pour Une Utilisation Rapide Et Efficace
Compatible MAC/PC, entièrement débloqué
Aucune Expertise N'Est Requise; Facile À Suivre
Shenzhen Mindray Bio-Medical Electronics Co., Ltd. (300760.SZ) Bundle
Évaluez les perspectives financières de Shenzhen Mindray Bio-Medical Electronics Co., Ltd. Comme un expert! Ce calculatrice DCF (300760SZ) fournit des données financières pré-remplies et offre une pleine flexibilité pour modifier la croissance des revenus, le WACC, les marges et d'autres hypothèses essentielles pour s'aligner sur vos projections.
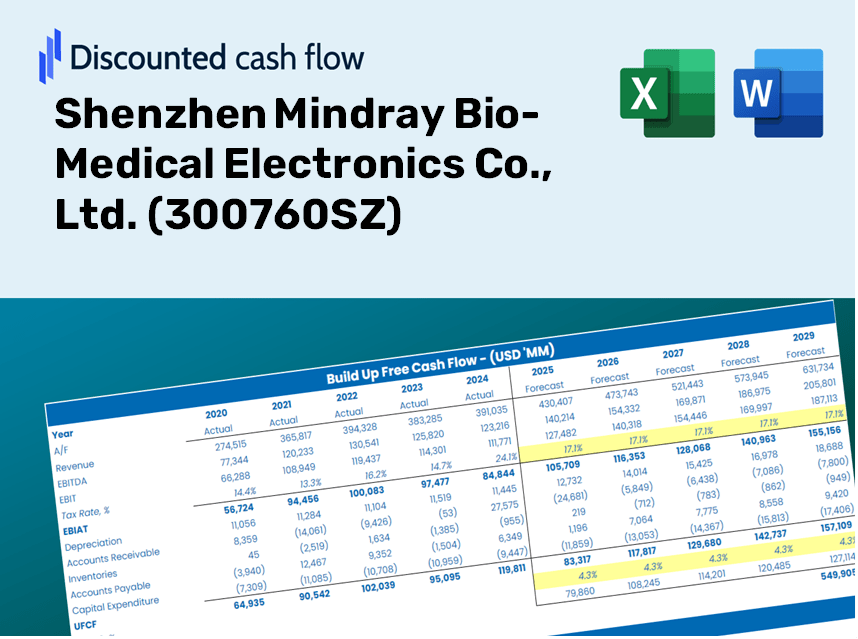
Discounted Cash Flow (DCF) - (USD MM)
| Year | AY1 2020 |
AY2 2021 |
AY3 2022 |
AY4 2023 |
AY5 2024 |
FY1 2025 |
FY2 2026 |
FY3 2027 |
FY4 2028 |
FY5 2029 |
|---|---|---|---|---|---|---|---|---|---|---|
| Revenue | 21,025.8 | 25,269.6 | 30,365.6 | 34,931.9 | 36,725.8 | 42,282.6 | 48,680.3 | 56,046.0 | 64,526.2 | 74,289.5 |
| Revenue Growth, % | 0 | 20.18 | 20.17 | 15.04 | 5.14 | 15.13 | 15.13 | 15.13 | 15.13 | 15.13 |
| EBITDA | 7,731.3 | 9,380.1 | 11,188.1 | 13,157.5 | 13,687.5 | 15,701.3 | 18,077.0 | 20,812.2 | 23,961.2 | 27,586.8 |
| EBITDA, % | 36.77 | 37.12 | 36.84 | 37.67 | 37.27 | 37.13 | 37.13 | 37.13 | 37.13 | 37.13 |
| Depreciation | 472.1 | 616.5 | 779.1 | 896.0 | 1,314.3 | 1,132.7 | 1,304.1 | 1,501.4 | 1,728.6 | 1,990.2 |
| Depreciation, % | 2.25 | 2.44 | 2.57 | 2.57 | 3.58 | 2.68 | 2.68 | 2.68 | 2.68 | 2.68 |
| EBIT | 7,259.1 | 8,763.6 | 10,409.0 | 12,261.5 | 12,373.2 | 14,568.6 | 16,772.9 | 19,310.8 | 22,232.6 | 25,596.6 |
| EBIT, % | 34.52 | 34.68 | 34.28 | 35.1 | 33.69 | 34.46 | 34.46 | 34.46 | 34.46 | 34.46 |
| Total Cash | 15,864.8 | 15,361.1 | 23,185.7 | 18,787.2 | 16,644.1 | 26,358.9 | 30,347.3 | 34,939.0 | 40,225.6 | 46,312.0 |
| Total Cash, percent | .0 | .0 | .0 | .0 | .0 | .0 | .0 | .0 | .0 | .0 |
| Account Receivables | 1,971.0 | 2,101.4 | 2,809.9 | 3,491.9 | 3,431.1 | 3,913.9 | 4,506.1 | 5,187.9 | 5,972.9 | 6,876.6 |
| Account Receivables, % | 9.37 | 8.32 | 9.25 | 10 | 9.34 | 9.26 | 9.26 | 9.26 | 9.26 | 9.26 |
| Inventories | 3,540.7 | 3,565.3 | 4,024.9 | 3,978.6 | 4,757.4 | 5,796.7 | 6,673.8 | 7,683.6 | 8,846.2 | 10,184.7 |
| Inventories, % | 16.84 | 14.11 | 13.25 | 11.39 | 12.95 | 13.71 | 13.71 | 13.71 | 13.71 | 13.71 |
| Accounts Payable | 1,499.6 | 2,281.1 | 2,290.6 | 2,690.4 | 2,792.5 | 3,298.7 | 3,797.9 | 4,372.5 | 5,034.1 | 5,795.8 |
| Accounts Payable, % | 7.13 | 9.03 | 7.54 | 7.7 | 7.6 | 7.8 | 7.8 | 7.8 | 7.8 | 7.8 |
| Capital Expenditure | -1,182.7 | -1,402.5 | -1,915.5 | -2,688.7 | -1,959.4 | -2,580.6 | -2,971.0 | -3,420.6 | -3,938.1 | -4,534.0 |
| Capital Expenditure, % | -5.63 | -5.55 | -6.31 | -7.7 | -5.34 | -6.1 | -6.1 | -6.1 | -6.1 | -6.1 |
| Tax Rate, % | 10.38 | 10.38 | 10.38 | 10.38 | 10.38 | 10.38 | 10.38 | 10.38 | 10.38 | 10.38 |
| EBITAT | 6,497.2 | 7,776.6 | 9,129.6 | 10,915.1 | 11,089.0 | 12,954.1 | 14,914.1 | 17,170.8 | 19,768.8 | 22,760.0 |
| Depreciation | ||||||||||
| Changes in Account Receivables | ||||||||||
| Changes in Inventories | ||||||||||
| Changes in Accounts Payable | ||||||||||
| Capital Expenditure | ||||||||||
| UFCF | 1,774.5 | 7,617.0 | 6,834.6 | 8,886.5 | 9,828.0 | 10,490.4 | 12,277.1 | 14,134.7 | 16,273.4 | 18,735.7 |
| WACC, % | 5.78 | 5.78 | 5.78 | 5.78 | 5.78 | 5.78 | 5.78 | 5.78 | 5.78 | 5.78 |
| PV UFCF | ||||||||||
| SUM PV UFCF | 59,981.7 | |||||||||
| Long Term Growth Rate, % | 3.00 | |||||||||
| Free cash flow (T + 1) | 19,298 | |||||||||
| Terminal Value | 695,037 | |||||||||
| Present Terminal Value | 524,882 | |||||||||
| Enterprise Value | 584,864 | |||||||||
| Net Debt | -16,461 | |||||||||
| Equity Value | 601,325 | |||||||||
| Diluted Shares Outstanding, MM | 1,211 | |||||||||
| Equity Value Per Share | 496.43 |
What You Will Receive
- Genuine 300760SZ Financial Data: Access to historical and projected figures for precise valuation.
- Customizable Inputs: Adjust WACC, tax rates, revenue growth, and capital expenditures to suit your analysis.
- Automated Calculations: Dynamic computation of intrinsic value and NPV.
- Scenario Analysis: Explore various scenarios to assess the future performance of Shenzhen Mindray Bio-Medical Electronics Co., Ltd.
- User-Friendly and Elegant Design: Designed for professionals but easy to navigate for beginners.
Key Features
- Pre-Loaded Data: Historical financial statements and forecasts for Shenzhen Mindray Bio-Medical Electronics Co., Ltd. (300760SZ).
- Fully Customizable Inputs: Adjust WACC, tax rates, revenue growth, and EBITDA margins easily.
- Real-Time Results: Instantly view the recalculated intrinsic value for Shenzhen Mindray Bio-Medical Electronics Co., Ltd. (300760SZ).
- Clear Visual Outputs: Dashboard charts showcase valuation results and essential metrics.
- Designed for Precision: A professional-grade tool tailored for analysts, investors, and finance professionals.
How It Operates
- Download the Template: Gain immediate access to the Excel-based Mindray DCF Calculator for (300760SZ).
- Input Your Assumptions: Modify the yellow-highlighted cells for growth projections, WACC, profit margins, and other key factors.
- Instant Calculations: The model automatically recalculates Mindray’s intrinsic value based on your inputs.
- Test Scenarios: Experiment with different assumptions to assess potential variations in valuation.
- Analyze and Decide: Utilize the outcomes to inform your investment choices or financial evaluations.
Why Opt for This Calculator?
- User-Friendly Interface: Perfect for both novices and seasoned professionals.
- Customizable Parameters: Easily adjust inputs to suit your analysis needs.
- Real-Time Adjustments: Observe immediate updates to Shenzhen Mindray Bio-Medical's valuation as you make changes.
- Preloaded Data: Comes equipped with Shenzhen Mindray's actual financial information for swift assessments.
- Relied Upon by Experts: Utilized by investors and analysts for informed decision-making.
Who Can Benefit from Mindray's Products?
- Healthcare Providers: Enhance patient care with advanced medical imaging and diagnostic equipment.
- Biomedical Engineers: Streamline your projects with innovative technology from a leading manufacturer.
- Medical Consultants: Leverage our solutions to create compelling presentations for your clients.
- Medical Researchers: Gain insights using our state-of-the-art devices in clinical trials and studies.
- Students and Educators: Utilize Mindray’s products as hands-on learning tools in health science programs.
Contents of the Template
- Operating and Balance Sheet Data: Pre-filled historical data and forecasts for Shenzhen Mindray Bio-Medical Electronics Co., Ltd. (300760SZ), including metrics like revenue, EBITDA, EBIT, and capital expenditures.
- WACC Calculation: A dedicated section for computing the Weighted Average Cost of Capital (WACC), encompassing variables such as Beta, risk-free rate, and share price.
- DCF Valuation (Unlevered and Levered): Editable Discounted Cash Flow models that reveal intrinsic value along with detailed breakdowns of calculations.
- Financial Statements: Pre-loaded financial statements for both annual and quarterly periods to facilitate comprehensive analysis.
- Key Ratios: A collection of key ratios focusing on profitability, leverage, and efficiency for Shenzhen Mindray Bio-Medical Electronics Co., Ltd. (300760SZ).
- Dashboard and Charts: A visual overview of valuation outputs and underlying assumptions to simplify result analysis.
Disclaimer
All information, articles, and product details provided on this website are for general informational and educational purposes only. We do not claim any ownership over, nor do we intend to infringe upon, any trademarks, copyrights, logos, brand names, or other intellectual property mentioned or depicted on this site. Such intellectual property remains the property of its respective owners, and any references here are made solely for identification or informational purposes, without implying any affiliation, endorsement, or partnership.
We make no representations or warranties, express or implied, regarding the accuracy, completeness, or suitability of any content or products presented. Nothing on this website should be construed as legal, tax, investment, financial, medical, or other professional advice. In addition, no part of this site—including articles or product references—constitutes a solicitation, recommendation, endorsement, advertisement, or offer to buy or sell any securities, franchises, or other financial instruments, particularly in jurisdictions where such activity would be unlawful.
All content is of a general nature and may not address the specific circumstances of any individual or entity. It is not a substitute for professional advice or services. Any actions you take based on the information provided here are strictly at your own risk. You accept full responsibility for any decisions or outcomes arising from your use of this website and agree to release us from any liability in connection with your use of, or reliance upon, the content or products found herein.