
|
Three Squirrels Inc. (300783.SZ) Évaluation DCF |
Entièrement Modifiable: Adapté À Vos Besoins Dans Excel Ou Sheets
Conception Professionnelle: Modèles Fiables Et Conformes Aux Normes Du Secteur
Pré-Construits Pour Une Utilisation Rapide Et Efficace
Compatible MAC/PC, entièrement débloqué
Aucune Expertise N'Est Requise; Facile À Suivre
Three Squirrels Inc. (300783.SZ) Bundle
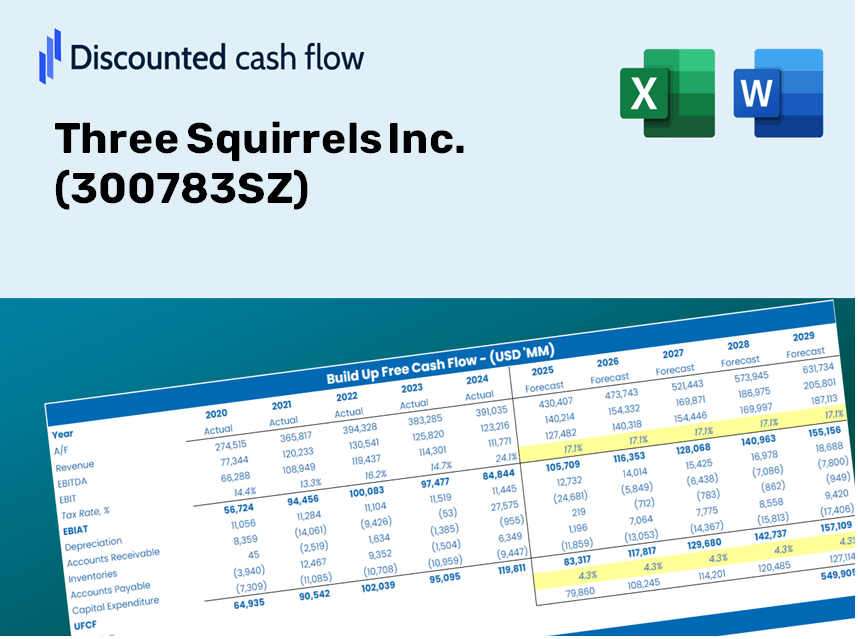
En tant qu'investisseur ou analyste, cette calculatrice DCF (300783SZ) est votre ressource incontournable pour une évaluation précise. Chargé de données réelles de Three Squirrels Inc., vous pouvez ajuster les prévisions et observer immédiatement les résultats.
What You Will Receive
- Genuine 300783SZ Financial Data: Access to historical and projected figures for precise valuation.
- Customizable Inputs: Adjust WACC, tax rates, revenue growth, and capital expenditures to fit your needs.
- Automated Calculations: Intrinsic value and NPV are computed in real-time.
- Scenario Testing: Explore various scenarios to assess Three Squirrels Inc.'s future potential.
- User-Friendly Interface: Designed for industry professionals while remaining approachable for newcomers.
Key Features
- Pre-Loaded Data: Historical financial statements and forecasts for Three Squirrels Inc. (300783SZ).
- Fully Adjustable Inputs: Modify WACC, tax rates, revenue growth, and EBITDA margins as needed.
- Instant Results: View the intrinsic value of Three Squirrels Inc. (300783SZ) recalculating in real time.
- Clear Visual Outputs: Dashboard charts showcase valuation results and essential metrics.
- Built for Accuracy: A professional-grade tool designed for analysts, investors, and finance professionals.
How It Works
- 1. Access the Template: Download and open the Excel file featuring data preloaded from Three Squirrels Inc. (300783SZ).
- 2. Adjust Key Inputs: Modify essential factors such as growth rates, WACC, and capital expenditures to fit your analysis.
- 3. Instant Results: The DCF model automatically updates to show the intrinsic value and NPV based on your inputs.
- 4. Explore Different Scenarios: Evaluate various forecasts to see how different assumptions impact the valuation.
- 5. Present with Assurance: Share detailed valuation insights confidently to inform your strategic decisions.
Reasons to Choose This Calculator for Three Squirrels Inc. (300783SZ)
- All-in-One Solution: Offers DCF, WACC, and financial ratio analyses seamlessly integrated.
- Flexible Inputs: Modify the yellow-highlighted fields to explore different scenarios.
- In-Depth Analysis: Automatically computes Three Squirrels Inc.'s intrinsic value and Net Present Value.
- Data-Driven: Comes with historical and projected data for more accurate calculations.
- Professional Standard: Perfect for financial analysts, investors, and business consultants.
Who Can Benefit from This Product?
- Investors: Effectively assess the fair value of Three Squirrels Inc. (300783SZ) prior to making investment choices.
- CFOs: Utilize a professional-grade DCF model for comprehensive financial reporting and analysis.
- Consultants: Quickly customize the template for client valuation reports tailored to Three Squirrels Inc. (300783SZ).
- Entrepreneurs: Discover financial modeling insights utilized by leading companies in the industry.
- Educators: Implement it as a pedagogical resource to illustrate various valuation methodologies.
Contents of the Template
- Preloaded Three Squirrels Inc. Data: Historical and forecasted financial data, including revenue, EBIT, and capital expenditures.
- DCF and WACC Models: Professional-grade sheets for calculating intrinsic value and Weighted Average Cost of Capital.
- Editable Inputs: Yellow-highlighted cells for customizing revenue growth, tax rates, and discount rates.
- Financial Statements: Detailed annual and quarterly financials for in-depth analysis.
- Key Ratios: Profitability, leverage, and efficiency ratios to assess performance.
- Dashboard and Charts: Visual summaries of valuation results and underlying assumptions.
Disclaimer
All information, articles, and product details provided on this website are for general informational and educational purposes only. We do not claim any ownership over, nor do we intend to infringe upon, any trademarks, copyrights, logos, brand names, or other intellectual property mentioned or depicted on this site. Such intellectual property remains the property of its respective owners, and any references here are made solely for identification or informational purposes, without implying any affiliation, endorsement, or partnership.
We make no representations or warranties, express or implied, regarding the accuracy, completeness, or suitability of any content or products presented. Nothing on this website should be construed as legal, tax, investment, financial, medical, or other professional advice. In addition, no part of this site—including articles or product references—constitutes a solicitation, recommendation, endorsement, advertisement, or offer to buy or sell any securities, franchises, or other financial instruments, particularly in jurisdictions where such activity would be unlawful.
All content is of a general nature and may not address the specific circumstances of any individual or entity. It is not a substitute for professional advice or services. Any actions you take based on the information provided here are strictly at your own risk. You accept full responsibility for any decisions or outcomes arising from your use of this website and agree to release us from any liability in connection with your use of, or reliance upon, the content or products found herein.