
|
Shenzhen New Industries Biomedical Engineering Co., Ltd. (300832.SZ) Valation DCF |
Entièrement Modifiable: Adapté À Vos Besoins Dans Excel Ou Sheets
Conception Professionnelle: Modèles Fiables Et Conformes Aux Normes Du Secteur
Pré-Construits Pour Une Utilisation Rapide Et Efficace
Compatible MAC/PC, entièrement débloqué
Aucune Expertise N'Est Requise; Facile À Suivre
Shenzhen New Industries Biomedical Engineering Co., Ltd. (300832.SZ) Bundle
Simplifiez Shenzhen New Industries Biomedical Engineering Co., Ltd. (300832SZ) Valation avec cette calculatrice DCF personnalisable! Doté de Real Shenzhen New Industries Biomedical Engineering Co., Ltd. (300832SZ) Financials and Rajustement Prévision des intrants, vous pouvez tester des scénarios et découvrir Shenzhen New Industries Biomedical Engineering Co., Ltd. (300832SZ) juste Value en quelques minutes.
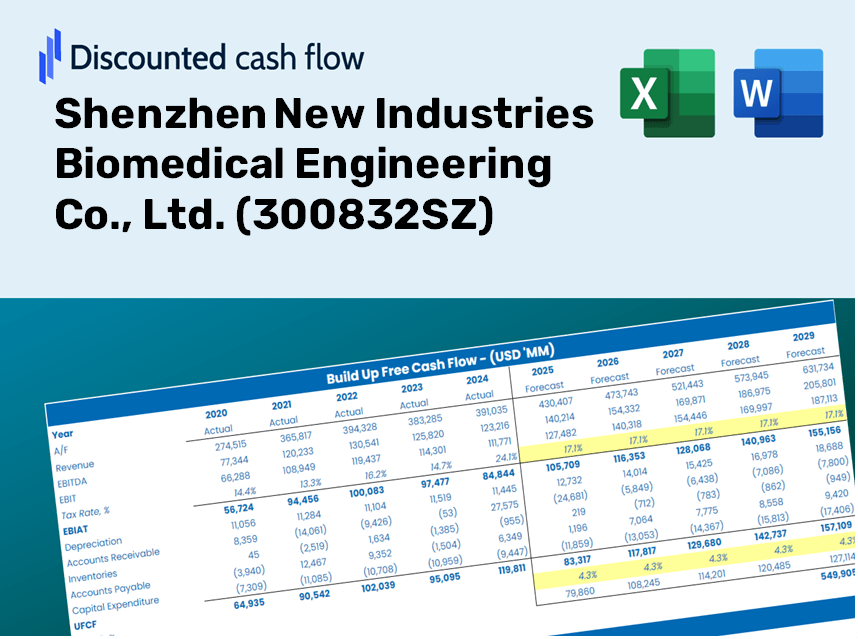
Discounted Cash Flow (DCF) - (USD MM)
| Year | AY1 2020 |
AY2 2021 |
AY3 2022 |
AY4 2023 |
AY5 2024 |
FY1 2025 |
FY2 2026 |
FY3 2027 |
FY4 2028 |
FY5 2029 |
|---|---|---|---|---|---|---|---|---|---|---|
| Revenue | 2,195.0 | 2,545.4 | 3,047.0 | 3,929.7 | 4,535.4 | 5,443.1 | 6,532.5 | 7,839.8 | 9,408.9 | 11,291.9 |
| Revenue Growth, % | 0 | 15.97 | 19.7 | 28.97 | 15.41 | 20.01 | 20.01 | 20.01 | 20.01 | 20.01 |
| EBITDA | 1,101.8 | 1,151.2 | 1,444.7 | 1,888.1 | 2,110.1 | 2,584.5 | 3,101.7 | 3,722.5 | 4,467.5 | 5,361.6 |
| EBITDA, % | 50.2 | 45.23 | 47.42 | 48.05 | 46.52 | 47.48 | 47.48 | 47.48 | 47.48 | 47.48 |
| Depreciation | 79.1 | 93.6 | 111.9 | 149.6 | 177.5 | 203.3 | 244.0 | 292.9 | 351.5 | 421.8 |
| Depreciation, % | 3.61 | 3.68 | 3.67 | 3.81 | 3.91 | 3.74 | 3.74 | 3.74 | 3.74 | 3.74 |
| EBIT | 1,022.6 | 1,057.6 | 1,332.9 | 1,738.5 | 1,932.5 | 2,381.2 | 2,857.7 | 3,429.7 | 4,116.1 | 4,939.8 |
| EBIT, % | 46.59 | 41.55 | 43.74 | 44.24 | 42.61 | 43.75 | 43.75 | 43.75 | 43.75 | 43.75 |
| Total Cash | 3,374.7 | 3,424.1 | 3,297.1 | 3,404.2 | 2,643.0 | 4,843.3 | 5,812.6 | 6,976.0 | 8,372.1 | 10,047.7 |
| Total Cash, percent | .0 | .0 | .0 | .0 | .0 | .0 | .0 | .0 | .0 | .0 |
| Account Receivables | 218.4 | 280.2 | 485.8 | 631.8 | 964.4 | 808.2 | 970.0 | 1,164.1 | 1,397.1 | 1,676.7 |
| Account Receivables, % | 9.95 | 11.01 | 15.94 | 16.08 | 21.26 | 14.85 | 14.85 | 14.85 | 14.85 | 14.85 |
| Inventories | 459.3 | 645.4 | 839.3 | 916.8 | 1,198.0 | 1,345.2 | 1,614.4 | 1,937.5 | 2,325.3 | 2,790.7 |
| Inventories, % | 20.92 | 25.35 | 27.55 | 23.33 | 26.41 | 24.71 | 24.71 | 24.71 | 24.71 | 24.71 |
| Accounts Payable | 98.3 | 171.4 | 176.7 | 127.0 | 456.6 | 329.9 | 396.0 | 475.2 | 570.3 | 684.4 |
| Accounts Payable, % | 4.48 | 6.73 | 5.8 | 3.23 | 10.07 | 6.06 | 6.06 | 6.06 | 6.06 | 6.06 |
| Capital Expenditure | -254.8 | -342.9 | -403.2 | -322.2 | -439.2 | -611.8 | -734.2 | -881.2 | -1,057.5 | -1,269.2 |
| Capital Expenditure, % | -11.61 | -13.47 | -13.23 | -8.2 | -9.68 | -11.24 | -11.24 | -11.24 | -11.24 | -11.24 |
| Tax Rate, % | 12.65 | 12.65 | 12.65 | 12.65 | 12.65 | 12.65 | 12.65 | 12.65 | 12.65 | 12.65 |
| EBITAT | 875.7 | 906.9 | 1,179.0 | 1,518.6 | 1,688.1 | 2,069.4 | 2,483.6 | 2,980.6 | 3,577.2 | 4,293.1 |
| Depreciation | ||||||||||
| Changes in Account Receivables | ||||||||||
| Changes in Inventories | ||||||||||
| Changes in Accounts Payable | ||||||||||
| Capital Expenditure | ||||||||||
| UFCF | 120.6 | 482.7 | 493.4 | 1,072.9 | 1,142.2 | 1,543.3 | 1,628.4 | 1,954.3 | 2,345.5 | 2,814.9 |
| WACC, % | 4.66 | 4.66 | 4.66 | 4.66 | 4.66 | 4.66 | 4.66 | 4.66 | 4.66 | 4.66 |
| PV UFCF | ||||||||||
| SUM PV UFCF | 8,862.9 | |||||||||
| Long Term Growth Rate, % | 3.50 | |||||||||
| Free cash flow (T + 1) | 2,913 | |||||||||
| Terminal Value | 251,524 | |||||||||
| Present Terminal Value | 200,314 | |||||||||
| Enterprise Value | 209,176 | |||||||||
| Net Debt | -917 | |||||||||
| Equity Value | 210,093 | |||||||||
| Diluted Shares Outstanding, MM | 786 | |||||||||
| Equity Value Per Share | 267.39 |
Benefits You Will Receive
- Edit Your Forecast Parameters: Seamlessly adjust key assumptions (growth %, margins, WACC) to explore various scenarios.
- Industry-Specific Data: Financial data for Shenzhen New Industries Biomedical Engineering Co., Ltd. (300832SZ) pre-loaded to enhance your analysis.
- Automated DCF Results: The template automatically computes Net Present Value (NPV) and intrinsic value for you.
- Customizable and Professional Design: A sleek Excel model tailored to meet your valuation requirements.
- Designed for Analysts and Investors: Perfect for assessing projections, validating strategies, and improving efficiency.
Key Features
- Real-Life SDBI Data: Pre-filled with Shenzhen New Industries Biomedical Engineering Co., Ltd.’s historical financials and forward-looking projections.
- Fully Customizable Inputs: Modify revenue growth rates, profit margins, WACC, tax rates, and capital expenditures to fit your analysis.
- Dynamic Valuation Model: Automatically computes Net Present Value (NPV) and intrinsic value based on your entered values.
- Scenario Testing: Generate various forecast scenarios to evaluate different valuation results.
- User-Friendly Interface: Intuitive and organized design, suitable for both professionals and novices.
How It Operates
- Download: Get the ready-to-use Excel file featuring financial data for Shenzhen New Industries Biomedical Engineering Co., Ltd. (300832SZ).
- Customize: Modify forecasts, including revenue growth, EBITDA %, and WACC as needed.
- Update Automatically: Enjoy real-time updates on intrinsic value and NPV calculations.
- Test Scenarios: Develop multiple projections and instantly compare the results.
- Make Decisions: Utilize the valuation outcomes to inform your investment strategy.
Why Choose Shenzhen New Industries Biomedical Engineering Co., Ltd. (300832SZ) Calculator?
- All-in-One Solution: Combines DCF, WACC, and financial ratio analyses in a single tool.
- Adjustable Parameters: Modify yellow-highlighted fields to explore different scenarios.
- In-Depth Analysis: Automatically computes the intrinsic value and Net Present Value for Shenzhen New Industries.
- Integrated Data: Features historical and forecast data for precise baseline calculations.
- High-Quality Standards: Perfect for financial analysts, investors, and business consultants in the biomedical sector.
Who Can Benefit from This Product?
- Individual Investors: Gain insights to make informed choices regarding transactions involving Shenzhen New Industries Biomedical Engineering Co., Ltd. (300832SZ).
- Financial Analysts: Enhance your evaluation methods with comprehensive financial models designed for the biomedical sector.
- Consultants: Provide timely and accurate valuation analyses for clients in the biomedical industry.
- Business Owners: Learn how major players like Shenzhen New Industries Biomedical Engineering Co., Ltd. (300832SZ) are valued to inform your own business strategies.
- Finance Students: Acquire practical valuation skills using real data and case studies related to the biomedical field.
Contents of the Template
- Preloaded SNIB Data: Historical and forecasted financial data, including revenue, EBIT, and capital expenditures.
- DCF and WACC Models: Professional-level sheets designed for calculating intrinsic value and Weighted Average Cost of Capital.
- Editable Inputs: Yellow-highlighted cells allowing for adjustments to revenue growth, tax rates, and discount rates.
- Financial Statements: Detailed annual and quarterly financials for in-depth analysis.
- Key Ratios: Profitability, leverage, and efficiency ratios to assess performance.
- Dashboard and Charts: Visual representations of valuation results and underlying assumptions.
Disclaimer
All information, articles, and product details provided on this website are for general informational and educational purposes only. We do not claim any ownership over, nor do we intend to infringe upon, any trademarks, copyrights, logos, brand names, or other intellectual property mentioned or depicted on this site. Such intellectual property remains the property of its respective owners, and any references here are made solely for identification or informational purposes, without implying any affiliation, endorsement, or partnership.
We make no representations or warranties, express or implied, regarding the accuracy, completeness, or suitability of any content or products presented. Nothing on this website should be construed as legal, tax, investment, financial, medical, or other professional advice. In addition, no part of this site—including articles or product references—constitutes a solicitation, recommendation, endorsement, advertisement, or offer to buy or sell any securities, franchises, or other financial instruments, particularly in jurisdictions where such activity would be unlawful.
All content is of a general nature and may not address the specific circumstances of any individual or entity. It is not a substitute for professional advice or services. Any actions you take based on the information provided here are strictly at your own risk. You accept full responsibility for any decisions or outcomes arising from your use of this website and agree to release us from any liability in connection with your use of, or reliance upon, the content or products found herein.