
|
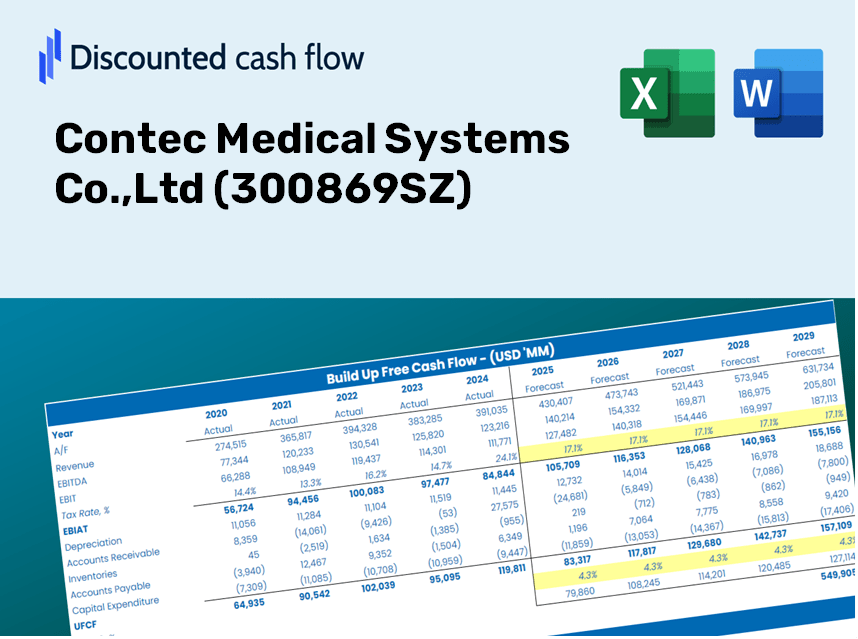
Contec Medical Systems Co., Ltd (300869.SZ) Évaluation DCF |
Entièrement Modifiable: Adapté À Vos Besoins Dans Excel Ou Sheets
Conception Professionnelle: Modèles Fiables Et Conformes Aux Normes Du Secteur
Pré-Construits Pour Une Utilisation Rapide Et Efficace
Compatible MAC/PC, entièrement débloqué
Aucune Expertise N'Est Requise; Facile À Suivre
Contec Medical Systems Co.,Ltd (300869.SZ) Bundle
Explorez l'avenir financier de Contec Medical Systems Co., Ltd (300869SZ) avec notre calculatrice DCF conviviale! Entrez vos prévisions de croissance, de marges et de coûts pour calculer la valeur intrinsèque de Contec Medical Systems Co., Ltd (300869SZ) et affinez votre stratégie d'investissement.
What You Will Receive
- Authentic 300869SZ Financials: Comprehensive historical and projected data for precise valuation.
- Customizable Inputs: Adjust WACC, tax rates, revenue growth, and capital expenses as needed.
- Automated Calculations: Intrinsic value and NPV are computed in real-time.
- Scenario Testing: Explore various scenarios to assess Contec Medical Systems’ future prospects.
- User-Friendly Design: Designed for professionals while remaining accessible to newcomers.
Key Features
- Authentic Financial Data: Access accurate historical figures and future forecasts for Contec Medical Systems Co., Ltd (300869SZ).
- Adjustable Forecast Parameters: Modify highlighted cells such as WACC, growth rates, and margins to fit your analysis.
- Real-Time Calculations: Automatic refresh of DCF, Net Present Value (NPV), and cash flow evaluations.
- Interactive Dashboard: Clear and concise visuals to help you interpret your valuation findings.
- Suitability for All Skill Levels: A user-friendly design tailored for investors, CFOs, and consultants alike.
How It Works
- Step 1: Download the prebuilt Excel template featuring Contec Medical Systems' data.
- Step 2: Navigate through the pre-filled sheets to familiarize yourself with the key metrics.
- Step 3: Modify the forecasts and assumptions in the editable yellow cells (WACC, growth, margins).
- Step 4: Instantly view updated results, including Contec Medical Systems' intrinsic value.
- Step 5: Make informed investment decisions or generate reports based on the outputs.
Why Opt for This Calculator?
- User-Friendly Interface: Tailored for both novices and experienced users.
- Customizable Inputs: Easily adjust parameters to suit your financial analysis.
- Real-Time Updates: Watch dynamic changes in Contec Medical Systems’ valuation as you modify inputs.
- Preloaded Data: Comes equipped with Contec Medical Systems’ actual financial figures for swift evaluations.
- Preferred by Experts: Utilized by investors and analysts for informed decision-making in the market.
Who Can Benefit from This Product?
- Investors: Accurately assess the fair value of Contec Medical Systems Co., Ltd (300869SZ) before making investment choices.
- CFOs: Utilize a top-tier DCF model for comprehensive financial reporting and analysis.
- Consultants: Efficiently customize the template for client valuation reports.
- Entrepreneurs: Acquire valuable insights into financial modeling techniques used by major corporations.
- Educators: Employ it as a pedagogical resource to illustrate various valuation methodologies.
What the Template Contains
- Preloaded 300869SZ Data: Historical and projected financial information, including revenue, EBIT, and capital expenditures.
- DCF and WACC Models: High-quality spreadsheets for estimating intrinsic value and Weighted Average Cost of Capital.
- Editable Inputs: Cells highlighted in yellow for modifying revenue growth, tax rates, and discount rates.
- Financial Statements: Detailed annual and quarterly financial data for comprehensive analysis.
- Key Ratios: Metrics for profitability, leverage, and efficiency to assess performance.
- Dashboard and Charts: Visual representations of valuation results and underlying assumptions.
Disclaimer
All information, articles, and product details provided on this website are for general informational and educational purposes only. We do not claim any ownership over, nor do we intend to infringe upon, any trademarks, copyrights, logos, brand names, or other intellectual property mentioned or depicted on this site. Such intellectual property remains the property of its respective owners, and any references here are made solely for identification or informational purposes, without implying any affiliation, endorsement, or partnership.
We make no representations or warranties, express or implied, regarding the accuracy, completeness, or suitability of any content or products presented. Nothing on this website should be construed as legal, tax, investment, financial, medical, or other professional advice. In addition, no part of this site—including articles or product references—constitutes a solicitation, recommendation, endorsement, advertisement, or offer to buy or sell any securities, franchises, or other financial instruments, particularly in jurisdictions where such activity would be unlawful.
All content is of a general nature and may not address the specific circumstances of any individual or entity. It is not a substitute for professional advice or services. Any actions you take based on the information provided here are strictly at your own risk. You accept full responsibility for any decisions or outcomes arising from your use of this website and agree to release us from any liability in connection with your use of, or reliance upon, the content or products found herein.