
|
Shenzhen Honor Electronic Co., Ltd. (300870.SZ) Évaluation DCF |
Entièrement Modifiable: Adapté À Vos Besoins Dans Excel Ou Sheets
Conception Professionnelle: Modèles Fiables Et Conformes Aux Normes Du Secteur
Pré-Construits Pour Une Utilisation Rapide Et Efficace
Compatible MAC/PC, entièrement débloqué
Aucune Expertise N'Est Requise; Facile À Suivre
Shenzhen Honor Electronic Co., Ltd. (300870.SZ) Bundle
Découvrez la vraie valeur de Shenzhen Honor Electronic Co., Ltd. (300870SZ) avec notre calculatrice avancée DCF! Ajustez les hypothèses clés, explorez divers scénarios et évaluez comment les changements influencent l'évaluation de Shenzhen Honor Electronic Co., Ltd. (300870SZ) - le tout dans un seul modèle Excel.
What You Will Receive
- Customizable Excel Template: An adaptable Excel-based DCF Calculator featuring pre-populated financials for Shenzhen Honor Electronic Co., Ltd. (300870SZ).
- Comprehensive Data: Access to historical figures and forward-looking projections (highlighted in the yellow cells).
- Adjustable Forecasts: Modify assumptions such as revenue growth, EBITDA %, and WACC as needed.
- Instant Calculations: Quickly observe how your inputs influence the valuation of Shenzhen Honor Electronic Co., Ltd. (300870SZ).
- Professional Resource: Designed for investors, CFOs, consultants, and financial analysts alike.
- Intuitive Layout: Organized for simplicity and ease of navigation, complete with step-by-step guidance.
Key Features
- Real-Life Honor Data: Pre-filled with Shenzhen Honor Electronic Co., Ltd.'s historical financials and future projections.
- Completely Customizable Inputs: Tailor revenue growth, profit margins, WACC, tax rates, and capital expenditures to your needs.
- Dynamic Valuation Model: Automatic recalculations of Net Present Value (NPV) and intrinsic value based on your selected inputs.
- Scenario Analysis: Generate multiple forecasting scenarios to evaluate various valuation outcomes.
- User-Friendly Interface: Intuitive and structured design suitable for both professionals and novices.
How It Works
- Step 1: Download the prebuilt Excel template containing Shenzhen Honor Electronic Co., Ltd.'s (300870SZ) data.
- Step 2: Review the pre-filled sheets to familiarize yourself with the essential metrics.
- Step 3: Modify forecasts and assumptions in the editable yellow cells (WACC, growth, margins).
- Step 4: Instantly access recalculated results, including the intrinsic value of Shenzhen Honor Electronic Co., Ltd. (300870SZ).
- Step 5: Use the outputs to make informed investment decisions or generate comprehensive reports.
Why Choose This Calculator for Shenzhen Honor Electronic Co., Ltd. (300870SZ)?
- User-Friendly Design: Tailored for both novices and experts.
- Customizable Inputs: Adjust parameters effortlessly to suit your analysis.
- Real-Time Feedback: Observe immediate changes in Shenzhen Honor's valuation as you modify inputs.
- Preloaded Data: Comes with Shenzhen Honor's actual financial information for quick evaluations.
- Professional Endorsement: Valued by investors and analysts for data-driven decision-making.
Who Can Benefit from This Product?
- Investors: Empower your investment choices with a high-quality valuation tool.
- Financial Analysts: Streamline your workflow with an easy-to-customize DCF model.
- Consultants: Effortlessly modify the template for client presentations or detailed reports.
- Finance Enthusiasts: Enhance your knowledge of valuation methods through practical examples.
- Educators and Students: Utilize it as an effective hands-on resource in finance-related studies.
What the Template Includes
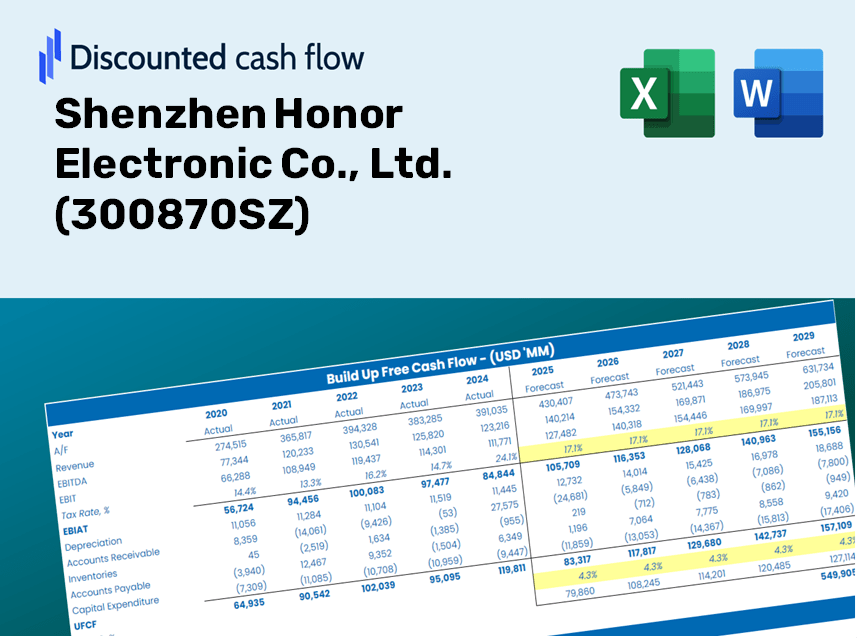
- Operating and Balance Sheet Data: Pre-filled historical data and forecasts for Shenzhen Honor Electronic Co., Ltd. (300870SZ), covering revenue, EBITDA, EBIT, and capital expenditures.
- WACC Calculation: A dedicated sheet for the Weighted Average Cost of Capital (WACC), incorporating parameters such as Beta, risk-free rate, and share price.
- DCF Valuation (Unlevered and Levered): Customizable Discounted Cash Flow models that present intrinsic value with comprehensive calculations.
- Financial Statements: Pre-loaded annual and quarterly financial statements to facilitate in-depth analysis.
- Key Ratios: Includes profitability, leverage, and efficiency ratios specifically for Shenzhen Honor Electronic Co., Ltd. (300870SZ).
- Dashboard and Charts: Visual representation of valuation outputs and assumptions for straightforward results analysis.
Disclaimer
All information, articles, and product details provided on this website are for general informational and educational purposes only. We do not claim any ownership over, nor do we intend to infringe upon, any trademarks, copyrights, logos, brand names, or other intellectual property mentioned or depicted on this site. Such intellectual property remains the property of its respective owners, and any references here are made solely for identification or informational purposes, without implying any affiliation, endorsement, or partnership.
We make no representations or warranties, express or implied, regarding the accuracy, completeness, or suitability of any content or products presented. Nothing on this website should be construed as legal, tax, investment, financial, medical, or other professional advice. In addition, no part of this site—including articles or product references—constitutes a solicitation, recommendation, endorsement, advertisement, or offer to buy or sell any securities, franchises, or other financial instruments, particularly in jurisdictions where such activity would be unlawful.
All content is of a general nature and may not address the specific circumstances of any individual or entity. It is not a substitute for professional advice or services. Any actions you take based on the information provided here are strictly at your own risk. You accept full responsibility for any decisions or outcomes arising from your use of this website and agree to release us from any liability in connection with your use of, or reliance upon, the content or products found herein.