
|
Guanglian Aviation Industry Co., Ltd. (300900.SZ) Évaluation DCF |
Entièrement Modifiable: Adapté À Vos Besoins Dans Excel Ou Sheets
Conception Professionnelle: Modèles Fiables Et Conformes Aux Normes Du Secteur
Pré-Construits Pour Une Utilisation Rapide Et Efficace
Compatible MAC/PC, entièrement débloqué
Aucune Expertise N'Est Requise; Facile À Suivre
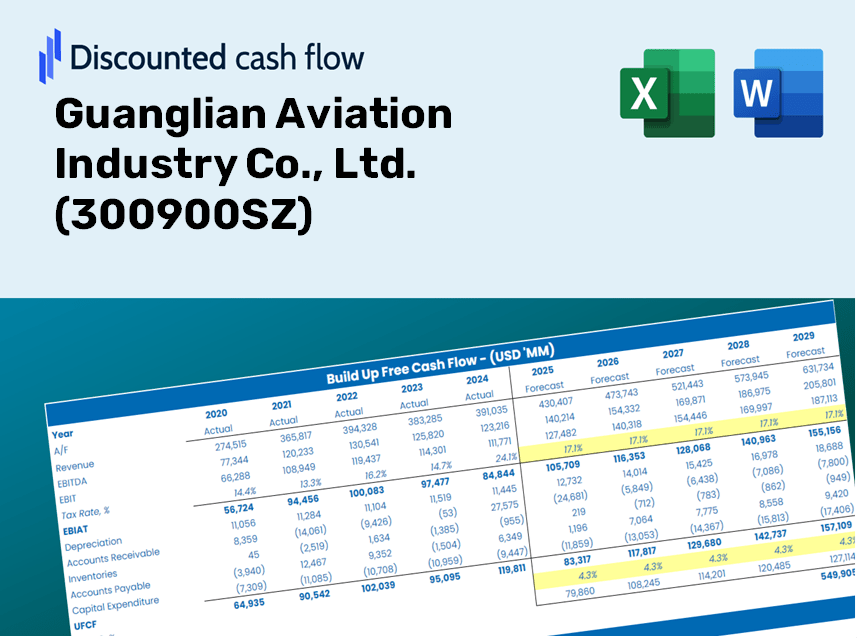
Guanglian Aviation Industry Co., Ltd. (300900.SZ) Bundle
Vous cherchez à évaluer la valeur intrinsèque de Guanglian Aviation Industry Co., Ltd.? Notre calculatrice DCF (300900SZ) intègre des données réelles avec des fonctionnalités de personnalisation approfondies, vous permettant d'affiner vos prévisions et de faire des choix d'investissement plus éclairés.
Discounted Cash Flow (DCF) - (USD MM)
| Year | AY1 2020 |
AY2 2021 |
AY3 2022 |
AY4 2023 |
AY5 2024 |
FY1 2025 |
FY2 2026 |
FY3 2027 |
FY4 2028 |
FY5 2029 |
|---|---|---|---|---|---|---|---|---|---|---|
| Revenue | 314.7 | 237.4 | 663.6 | 740.0 | 1,048.1 | 1,385.1 | 1,830.3 | 2,418.6 | 3,196.1 | 4,223.5 |
| Revenue Growth, % | 0 | -24.56 | 179.55 | 11.5 | 41.64 | 32.15 | 32.15 | 32.15 | 32.15 | 32.15 |
| EBITDA | 148.7 | 91.0 | 285.3 | 285.5 | 208.2 | 518.1 | 684.6 | 904.7 | 1,195.5 | 1,579.8 |
| EBITDA, % | 47.26 | 38.32 | 42.99 | 38.58 | 19.86 | 37.4 | 37.4 | 37.4 | 37.4 | 37.4 |
| Depreciation | 31.0 | 45.2 | 87.8 | 130.6 | 198.8 | 218.1 | 288.2 | 380.9 | 503.3 | 665.1 |
| Depreciation, % | 9.85 | 19.04 | 13.23 | 17.65 | 18.97 | 15.75 | 15.75 | 15.75 | 15.75 | 15.75 |
| EBIT | 117.7 | 45.8 | 197.5 | 154.9 | 9.3 | 300.0 | 396.4 | 523.8 | 692.2 | 914.7 |
| EBIT, % | 37.42 | 19.28 | 29.76 | 20.94 | 0.89068 | 21.66 | 21.66 | 21.66 | 21.66 | 21.66 |
| Total Cash | 667.9 | 363.4 | 157.6 | 381.4 | 419.0 | 873.3 | 1,154.0 | 1,525.0 | 2,015.2 | 2,663.0 |
| Total Cash, percent | .0 | .0 | .0 | .0 | .0 | .0 | .0 | .0 | .0 | .0 |
| Account Receivables | 424.0 | 438.2 | 681.4 | 808.3 | 830.3 | 1,327.5 | 1,754.2 | 2,318.1 | 3,063.3 | 4,048.0 |
| Account Receivables, % | 134.74 | 184.57 | 102.68 | 109.23 | 79.22 | 95.84 | 95.84 | 95.84 | 95.84 | 95.84 |
| Inventories | 80.7 | 169.0 | 316.0 | 452.6 | 697.8 | 753.9 | 996.3 | 1,316.5 | 1,739.7 | 2,299.0 |
| Inventories, % | 25.63 | 71.18 | 47.62 | 61.16 | 66.57 | 54.43 | 54.43 | 54.43 | 54.43 | 54.43 |
| Accounts Payable | 74.7 | 76.6 | 218.2 | 59.3 | 486.8 | 397.1 | 524.7 | 693.4 | 916.3 | 1,210.8 |
| Accounts Payable, % | 23.72 | 32.28 | 32.89 | 8.01 | 46.45 | 28.67 | 28.67 | 28.67 | 28.67 | 28.67 |
| Capital Expenditure | -159.3 | -379.7 | -703.7 | -825.5 | -400.1 | -1,077.0 | -1,423.2 | -1,880.8 | -2,485.3 | -3,284.2 |
| Capital Expenditure, % | -50.63 | -159.94 | -106.03 | -111.56 | -38.17 | -77.76 | -77.76 | -77.76 | -77.76 | -77.76 |
| Tax Rate, % | 28.31 | 28.31 | 28.31 | 28.31 | 28.31 | 28.31 | 28.31 | 28.31 | 28.31 | 28.31 |
| EBITAT | 102.7 | 42.0 | 170.4 | 167.8 | 6.7 | 262.2 | 346.5 | 457.9 | 605.1 | 799.6 |
| Depreciation | ||||||||||
| Changes in Account Receivables | ||||||||||
| Changes in Inventories | ||||||||||
| Changes in Accounts Payable | ||||||||||
| Capital Expenditure | ||||||||||
| UFCF | -455.6 | -392.9 | -694.1 | -949.5 | -34.2 | -1,239.8 | -1,330.0 | -1,757.5 | -2,322.4 | -3,069.0 |
| WACC, % | 4.3 | 4.35 | 4.29 | 4.45 | 4.11 | 4.3 | 4.3 | 4.3 | 4.3 | 4.3 |
| PV UFCF | ||||||||||
| SUM PV UFCF | -8,408.7 | |||||||||
| Long Term Growth Rate, % | 2.00 | |||||||||
| Free cash flow (T + 1) | -3,130 | |||||||||
| Terminal Value | -136,027 | |||||||||
| Present Terminal Value | -110,199 | |||||||||
| Enterprise Value | -118,607 | |||||||||
| Net Debt | 1,576 | |||||||||
| Equity Value | -120,183 | |||||||||
| Diluted Shares Outstanding, MM | 289 | |||||||||
| Equity Value Per Share | -416.13 |
Benefits You Will Receive
- Customizable Excel Template: A fully adjustable Excel-based DCF Calculator featuring pre-populated financial data for Guanglian Aviation Industry Co., Ltd. (300900SZ).
- Accurate Data: Historical performance metrics and projections for future performance (highlighted in the yellow cells).
- Flexible Forecasting: Modify key assumptions such as revenue growth, EBITDA percentage, and WACC at your discretion.
- Instant Calculations: Immediately observe how your input variables influence the valuation of Guanglian Aviation Industry Co., Ltd. (300900SZ).
- Professional-Grade Tool: Designed for investors, CFOs, consultants, and financial analysts alike.
- User-Friendly Interface: Organized for simplicity and accessibility, complemented by detailed step-by-step guidance.
Key Features
- Accurate Guanglian Financials: Gain access to reliable pre-loaded historical data and future forecasts.
- Adjustable Forecast Parameters: Modify yellow-highlighted cells such as WACC, growth rates, and profit margins.
- Real-Time Calculations: Automatic updates for DCF, Net Present Value (NPV), and cash flow analysis.
- Interactive Dashboard: User-friendly charts and summaries to effectively visualize your valuation findings.
- Tailored for All Users: A clear, intuitive design suitable for investors, CFOs, and consultants alike.
How It Operates
- Download the Template: Gain immediate access to the Excel-based Guanglian Aviation DCF Calculator.
- Input Your Assumptions: Modify the yellow-highlighted cells to enter growth rates, WACC, margins, and other variables.
- Instant Calculations: The model automatically updates the intrinsic value of Guanglian Aviation.
- Test Scenarios: Experiment with various assumptions to assess potential changes in valuation.
- Analyze and Decide: Utilize the results to inform your investment strategy or financial analysis.
Why Choose This Calculator for Guanglian Aviation Industry Co., Ltd. (300900SZ)?
- Reliable Data: Utilizes authentic Guanglian Aviation financials for trustworthy valuation results.
- Tailorable: Modify essential variables such as growth rates, WACC, and tax rates to align with your forecasts.
- Efficient: Built-in calculations save you time by bypassing the need to create from the ground up.
- Professional-Grade Resource: Crafted for investors, analysts, and consultants in the aviation sector.
- Easy to Use: Designed with an intuitive interface and clear instructions for all users.
Who Can Benefit from This Product?
- Investors: Effectively assess the fair value of Guanglian Aviation Industry Co., Ltd. (300900SZ) prior to investment decisions.
- CFOs: Utilize a high-quality DCF model for precise financial reporting and analysis.
- Consultants: Quickly customize the template for valuation reports tailored to clients.
- Entrepreneurs: Discover financial modeling techniques employed by leading aviation firms.
- Educators: Employ it as a resource for teaching valuation methods in finance courses.
Overview of Template Features
- Preloaded Guanglian Data: Historical and forecasted financial figures, including revenue, EBIT, and capital expenditures.
- DCF and WACC Models: High-quality spreadsheets designed for calculating intrinsic value and Weighted Average Cost of Capital.
- Customizable Inputs: Yellow-highlighted cells for modifying revenue growth, tax rates, and discount rates.
- Financial Statements: Detailed annual and quarterly financials for in-depth analysis.
- Key Ratios: Metrics for profitability, leverage, and efficiency to assess performance.
- Dashboard and Charts: Visual representations of valuation results and assumptions.
Disclaimer
All information, articles, and product details provided on this website are for general informational and educational purposes only. We do not claim any ownership over, nor do we intend to infringe upon, any trademarks, copyrights, logos, brand names, or other intellectual property mentioned or depicted on this site. Such intellectual property remains the property of its respective owners, and any references here are made solely for identification or informational purposes, without implying any affiliation, endorsement, or partnership.
We make no representations or warranties, express or implied, regarding the accuracy, completeness, or suitability of any content or products presented. Nothing on this website should be construed as legal, tax, investment, financial, medical, or other professional advice. In addition, no part of this site—including articles or product references—constitutes a solicitation, recommendation, endorsement, advertisement, or offer to buy or sell any securities, franchises, or other financial instruments, particularly in jurisdictions where such activity would be unlawful.
All content is of a general nature and may not address the specific circumstances of any individual or entity. It is not a substitute for professional advice or services. Any actions you take based on the information provided here are strictly at your own risk. You accept full responsibility for any decisions or outcomes arising from your use of this website and agree to release us from any liability in connection with your use of, or reliance upon, the content or products found herein.