
|
Ningbo Zhenyu Technology Co., Ltd. (300953.SZ) Évaluation DCF |
Entièrement Modifiable: Adapté À Vos Besoins Dans Excel Ou Sheets
Conception Professionnelle: Modèles Fiables Et Conformes Aux Normes Du Secteur
Pré-Construits Pour Une Utilisation Rapide Et Efficace
Compatible MAC/PC, entièrement débloqué
Aucune Expertise N'Est Requise; Facile À Suivre
Ningbo Zhenyu Technology Co., Ltd. (300953.SZ) Bundle
Gardez un aperçu de votre analyse d'évaluation de votre Ningbo Zhenyu Technology Co., Ltd. (300953SZ) avec notre calculatrice DCF de pointe! Équipée de données réelles (300953SZ), ce modèle Excel vous permet d'ajuster les prévisions et les hypothèses pour déterminer avec précision la valeur intrinsèque de Ningbo Zhenyu Technology Co., Ltd.
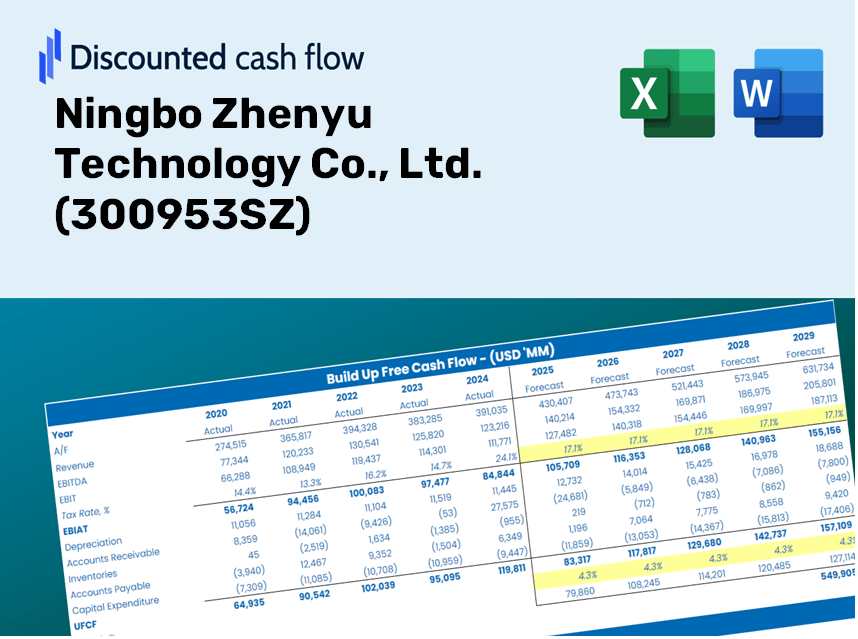
Discounted Cash Flow (DCF) - (USD MM)
| Year | AY1 2020 |
AY2 2021 |
AY3 2022 |
AY4 2023 |
AY5 2024 |
FY1 2025 |
FY2 2026 |
FY3 2027 |
FY4 2028 |
FY5 2029 |
|---|---|---|---|---|---|---|---|---|---|---|
| Revenue | 1,192.8 | 3,034.1 | 5,752.3 | 6,018.5 | 7,128.7 | 10,918.7 | 16,723.7 | 25,614.9 | 39,233.1 | 60,091.6 |
| Revenue Growth, % | 0 | 154.37 | 89.59 | 4.63 | 18.45 | 53.17 | 53.17 | 53.17 | 53.17 | 53.17 |
| EBITDA | 220.6 | 283.3 | 261.8 | 332.5 | 716.4 | 1,047.3 | 1,604.1 | 2,456.9 | 3,763.1 | 5,763.7 |
| EBITDA, % | 18.49 | 9.34 | 4.55 | 5.52 | 10.05 | 9.59 | 9.59 | 9.59 | 9.59 | 9.59 |
| Depreciation | 52.0 | 74.4 | 125.7 | 244.7 | 328.1 | 385.7 | 590.7 | 904.8 | 1,385.8 | 2,122.6 |
| Depreciation, % | 4.36 | 2.45 | 2.19 | 4.07 | 4.6 | 3.53 | 3.53 | 3.53 | 3.53 | 3.53 |
| EBIT | 168.6 | 208.9 | 136.1 | 87.8 | 388.3 | 661.6 | 1,013.4 | 1,552.1 | 2,377.3 | 3,641.2 |
| EBIT, % | 14.14 | 6.89 | 2.37 | 1.46 | 5.45 | 6.06 | 6.06 | 6.06 | 6.06 | 6.06 |
| Total Cash | 64.3 | 391.5 | 789.4 | 1,593.2 | 1,350.4 | 1,690.9 | 2,589.8 | 3,966.7 | 6,075.6 | 9,305.8 |
| Total Cash, percent | .0 | .0 | .0 | .0 | .0 | .0 | .0 | .0 | .0 | .0 |
| Account Receivables | 799.4 | 1,304.4 | 2,409.0 | 3,655.8 | 3,967.3 | 5,858.6 | 8,973.4 | 13,744.1 | 21,051.2 | 32,243.1 |
| Account Receivables, % | 67.02 | 42.99 | 41.88 | 60.74 | 55.65 | 53.66 | 53.66 | 53.66 | 53.66 | 53.66 |
| Inventories | 215.7 | 622.0 | 916.5 | 846.4 | 990.2 | 1,801.0 | 2,758.5 | 4,225.1 | 6,471.4 | 9,911.9 |
| Inventories, % | 18.09 | 20.5 | 15.93 | 14.06 | 13.89 | 16.49 | 16.49 | 16.49 | 16.49 | 16.49 |
| Accounts Payable | 500.6 | 1,457.5 | 2,366.3 | 3,464.2 | 2,890.3 | 5,006.1 | 7,667.6 | 11,744.1 | 17,987.9 | 27,551.3 |
| Accounts Payable, % | 41.97 | 48.04 | 41.14 | 57.56 | 40.54 | 45.85 | 45.85 | 45.85 | 45.85 | 45.85 |
| Capital Expenditure | -135.9 | -437.1 | -902.4 | -703.8 | -303.0 | -1,254.1 | -1,920.8 | -2,942.0 | -4,506.2 | -6,901.9 |
| Capital Expenditure, % | -11.39 | -14.41 | -15.69 | -11.69 | -4.25 | -11.49 | -11.49 | -11.49 | -11.49 | -11.49 |
| Tax Rate, % | 3.1 | 3.1 | 3.1 | 3.1 | 3.1 | 3.1 | 3.1 | 3.1 | 3.1 | 3.1 |
| EBITAT | 143.6 | 195.3 | 228.6 | 199.1 | 376.3 | 629.2 | 963.7 | 1,476.0 | 2,260.8 | 3,462.7 |
| Depreciation | ||||||||||
| Changes in Account Receivables | ||||||||||
| Changes in Inventories | ||||||||||
| Changes in Accounts Payable | ||||||||||
| Capital Expenditure | ||||||||||
| UFCF | -454.9 | -121.8 | -1,038.3 | -338.8 | -627.9 | -825.5 | -1,777.2 | -2,722.0 | -4,169.2 | -6,385.8 |
| WACC, % | 6.59 | 6.64 | 6.68 | 6.68 | 6.66 | 6.65 | 6.65 | 6.65 | 6.65 | 6.65 |
| PV UFCF | ||||||||||
| SUM PV UFCF | -12,430.6 | |||||||||
| Long Term Growth Rate, % | 4.00 | |||||||||
| Free cash flow (T + 1) | -6,641 | |||||||||
| Terminal Value | -250,483 | |||||||||
| Present Terminal Value | -181,529 | |||||||||
| Enterprise Value | -193,960 | |||||||||
| Net Debt | 2,907 | |||||||||
| Equity Value | -196,866 | |||||||||
| Diluted Shares Outstanding, MM | 140 | |||||||||
| Equity Value Per Share | -1,410.90 |
What You Will Receive
- Authentic 300953 Financial Data: Pre-loaded with Ningbo Zhenyu's historical and forecasted data for accurate analysis.
- Completely Customizable Template: Easily adjust key parameters such as revenue growth, WACC, and EBITDA percentage.
- Instant Calculations: Watch the intrinsic value of Ningbo Zhenyu update in real-time as you make adjustments.
- Expert Valuation Tool: Tailored for investors, analysts, and consultants aiming for precise DCF outcomes.
- Intuitive User Interface: Organized layout and straightforward instructions suitable for every skill level.
Highlighted Features
- Authentic Financial Data for Ningbo Zhenyu: Gain access to precise historical figures and future forecasts.
- Flexible Forecast Assumptions: Modify highlighted cells for key inputs like WACC, growth rates, and profit margins.
- Real-Time Calculations: Automatically refresh DCF, Net Present Value (NPV), and cash flow analyses.
- Interactive Dashboard: User-friendly charts and summaries to effectively present your valuation findings.
- Designed for All Levels: A straightforward, intuitive platform tailored for investors, CFOs, and consultants alike.
How It Works
- Download the Template: Obtain immediate access to the Excel-based DCF Calculator for Ningbo Zhenyu Technology Co., Ltd. (300953SZ).
- Input Your Assumptions: Modify the yellow-highlighted cells for growth rates, WACC, profit margins, and other variables.
- Instant Calculations: The model will automatically refresh to reflect the intrinsic value of Ningbo Zhenyu Technology Co., Ltd. (300953SZ).
- Test Scenarios: Experiment with various assumptions to see how they impact valuation outcomes.
- Analyze and Decide: Utilize the findings to inform your investment strategies or financial assessments.
Why Choose This Calculator for Ningbo Zhenyu Technology Co., Ltd. (300953SZ)?
- Accurate Data: Utilize real financial figures from Ningbo Zhenyu to ensure dependable valuation outcomes.
- Customizable: Modify essential parameters such as growth rates, WACC, and tax rates to align with your forecasts.
- Time-Saving: Pre-configured calculations allow you to avoid starting from zero.
- Professional-Grade Tool: Tailored for investors, analysts, and consultants specializing in tech companies.
- User-Friendly: With an intuitive design and straightforward guidance, it’s accessible for all users.
Who Can Benefit from This Product?
- Finance Students: Master valuation methods and apply them using real-world data.
- Researchers: Integrate advanced valuation models into your academic projects or studies.
- Investors: Validate your investment theories and evaluate valuation results for Ningbo Zhenyu Technology Co., Ltd. (300953SZ).
- Financial Analysts: Enhance your efficiency with a customizable, ready-to-use DCF model.
- Entrepreneurs: Discover how established public companies like Ningbo Zhenyu Technology Co., Ltd. (300953SZ) are assessed.
Contents of the Template
- Operating and Balance Sheet Data: Pre-filled historical data and forecasts for Ningbo Zhenyu Technology Co., Ltd. (300953SZ), including metrics such as revenue, EBITDA, EBIT, and capital expenditures.
- WACC Calculation: A dedicated sheet for the Weighted Average Cost of Capital (WACC), featuring essential parameters like Beta, risk-free rate, and share price.
- DCF Valuation (Unlevered and Levered): Customizable Discounted Cash Flow models that illustrate intrinsic value with comprehensive calculations.
- Financial Statements: Pre-loaded annual and quarterly financial statements to facilitate thorough analysis.
- Key Ratios: Includes metrics related to profitability, leverage, and efficiency for Ningbo Zhenyu Technology Co., Ltd. (300953SZ).
- Dashboard and Charts: A visual overview of valuation outcomes and assumptions for easy analysis of results.
Disclaimer
All information, articles, and product details provided on this website are for general informational and educational purposes only. We do not claim any ownership over, nor do we intend to infringe upon, any trademarks, copyrights, logos, brand names, or other intellectual property mentioned or depicted on this site. Such intellectual property remains the property of its respective owners, and any references here are made solely for identification or informational purposes, without implying any affiliation, endorsement, or partnership.
We make no representations or warranties, express or implied, regarding the accuracy, completeness, or suitability of any content or products presented. Nothing on this website should be construed as legal, tax, investment, financial, medical, or other professional advice. In addition, no part of this site—including articles or product references—constitutes a solicitation, recommendation, endorsement, advertisement, or offer to buy or sell any securities, franchises, or other financial instruments, particularly in jurisdictions where such activity would be unlawful.
All content is of a general nature and may not address the specific circumstances of any individual or entity. It is not a substitute for professional advice or services. Any actions you take based on the information provided here are strictly at your own risk. You accept full responsibility for any decisions or outcomes arising from your use of this website and agree to release us from any liability in connection with your use of, or reliance upon, the content or products found herein.